Fond memories of a high school personal project - cross country race analysis
The project was equal parts fun and cursed. Also wildly important for getting me into software.
I have been drafting this post for a long time, but kept putting off publishing. Lobsters is running a Blog Carnival, which felt like a good opportunity to set a deadline that I would have to commit to! Back in high school I turned my personal project into my senior project in order to force me to work on it. In that same spirit I'm making my blog carnival entry so I actually write the post.
The theme for the carnival is:
What have you made for yourself?
What is your least favorite/the most “cursed” part about it?
What was the project
See, I ran cross country and I had a really dedicated coach. [^ They recently named a trail after him because he is so awesome https://www.independentri.com/sports/article_55eb91f9-283c-4e1e-8abd-1ea38b73305e.html] He used Jack Daniels recommendations from The Running Formula to build training plans for us. That involved using our race results to calculate our VDOTs. Those were then used to set our training intensities. Circa 2011 I don't think many high school coaches did that and I really appreciate that he did.
One day I realized that all of the race results were posted to the Rhode Island Track and Field Association website. My machinations were as follows:
- Somehow get a copy of every race result on the RITCA site.
- Somehow pull all the information from the race results.
- Somehow analyze all the race results.
- Somehow display the analysis.
This was the first real project I ever set out on. Prior to this I had only done toy programs and practice problems from books. Part of that was because I was trying to learn C++ and mostly just spent my time battling the linker. Cue #353, I tried out Python and "everything is so simple". One lovely side effect of this project was finding a language I like and continue to use 14 years later.
However, that also meant that I was both learning a new language and how to write software in the large at the same time. Truly building the plane while I was flying. I bought a copy of Dive into Python and installed Python on Windows. This was 2011, so all my Python code was 2.7.2. Python 3 existed, but Django still on the Wall of Shame. I wrote everything using IDLE, the default IDE installed with Python, because I didn't even think to look for anything else. [^ Vim didn't enter my life until college. Now a days I'm old, grumpy, and use PyCharm.]
Honestly even then "programming was fun again".
I made a crawler
My first goal was to "somehow get a copy of every race result on the RITCA site". I found out about the concept of a crawler and tried to make one.
On the website there was a top-level page with a table:
| Year | Event | Season | Type | Gender | Teams | Download Results | ||||
|---|---|---|---|---|---|---|---|---|---|---|
| 2011 | 9 | 10 | Marshall Race | 2011-2012 | Cross-Country | Boys | no | Results | ||
| 2011 | 9 | 10 | Lowery Race | 2011-2012 | Cross-Country | Boys | no | Results | ||
| 2011 | 9 | 10 | Platt III Race | 2011-2012 | Cross-Country | Boys | no | Results | ||
| 2011 | 9 | 10 | Lawton Race | 2011-2012 | Cross-Country | Boys | no | Results | ||
| 2011 | 9 | 10 | Boys Freshmen | 2011-2012 | Cross-Country | Boys | no | Results | ||
| 2011 | 9 | 10 | Roy Race | 2011-2012 | Cross-Country | Girls | no | Results | ||
| 2011 | 9 | 10 | Hindley Race | 2011-2012 | Cross-Country | Girls | no | Results | ||
| [^ Interestingly enough the website's design is essentially unchanged since I visited in 2011. Also, they stopped posting results in 2015.] |
Each row linked to a race result. There was no pagination for the table which meant I only had to fetch a single page. I knew nothing about frameworks for crawling. I would later learn about Scrapy when I did my internship project.
There was a time where you could only have a limited number of private repos on GitHub for free. I eventually removed this project off of GitHub and "backed it up". [^ Ironically I specifically learned git for this project.] The project code is of course lost now. However, my senior project binder has printouts of an older version of the code! I made some scans for this post and I was originally going to OCR the text and clean it up, but... attention span.
Anyways, the crawler:
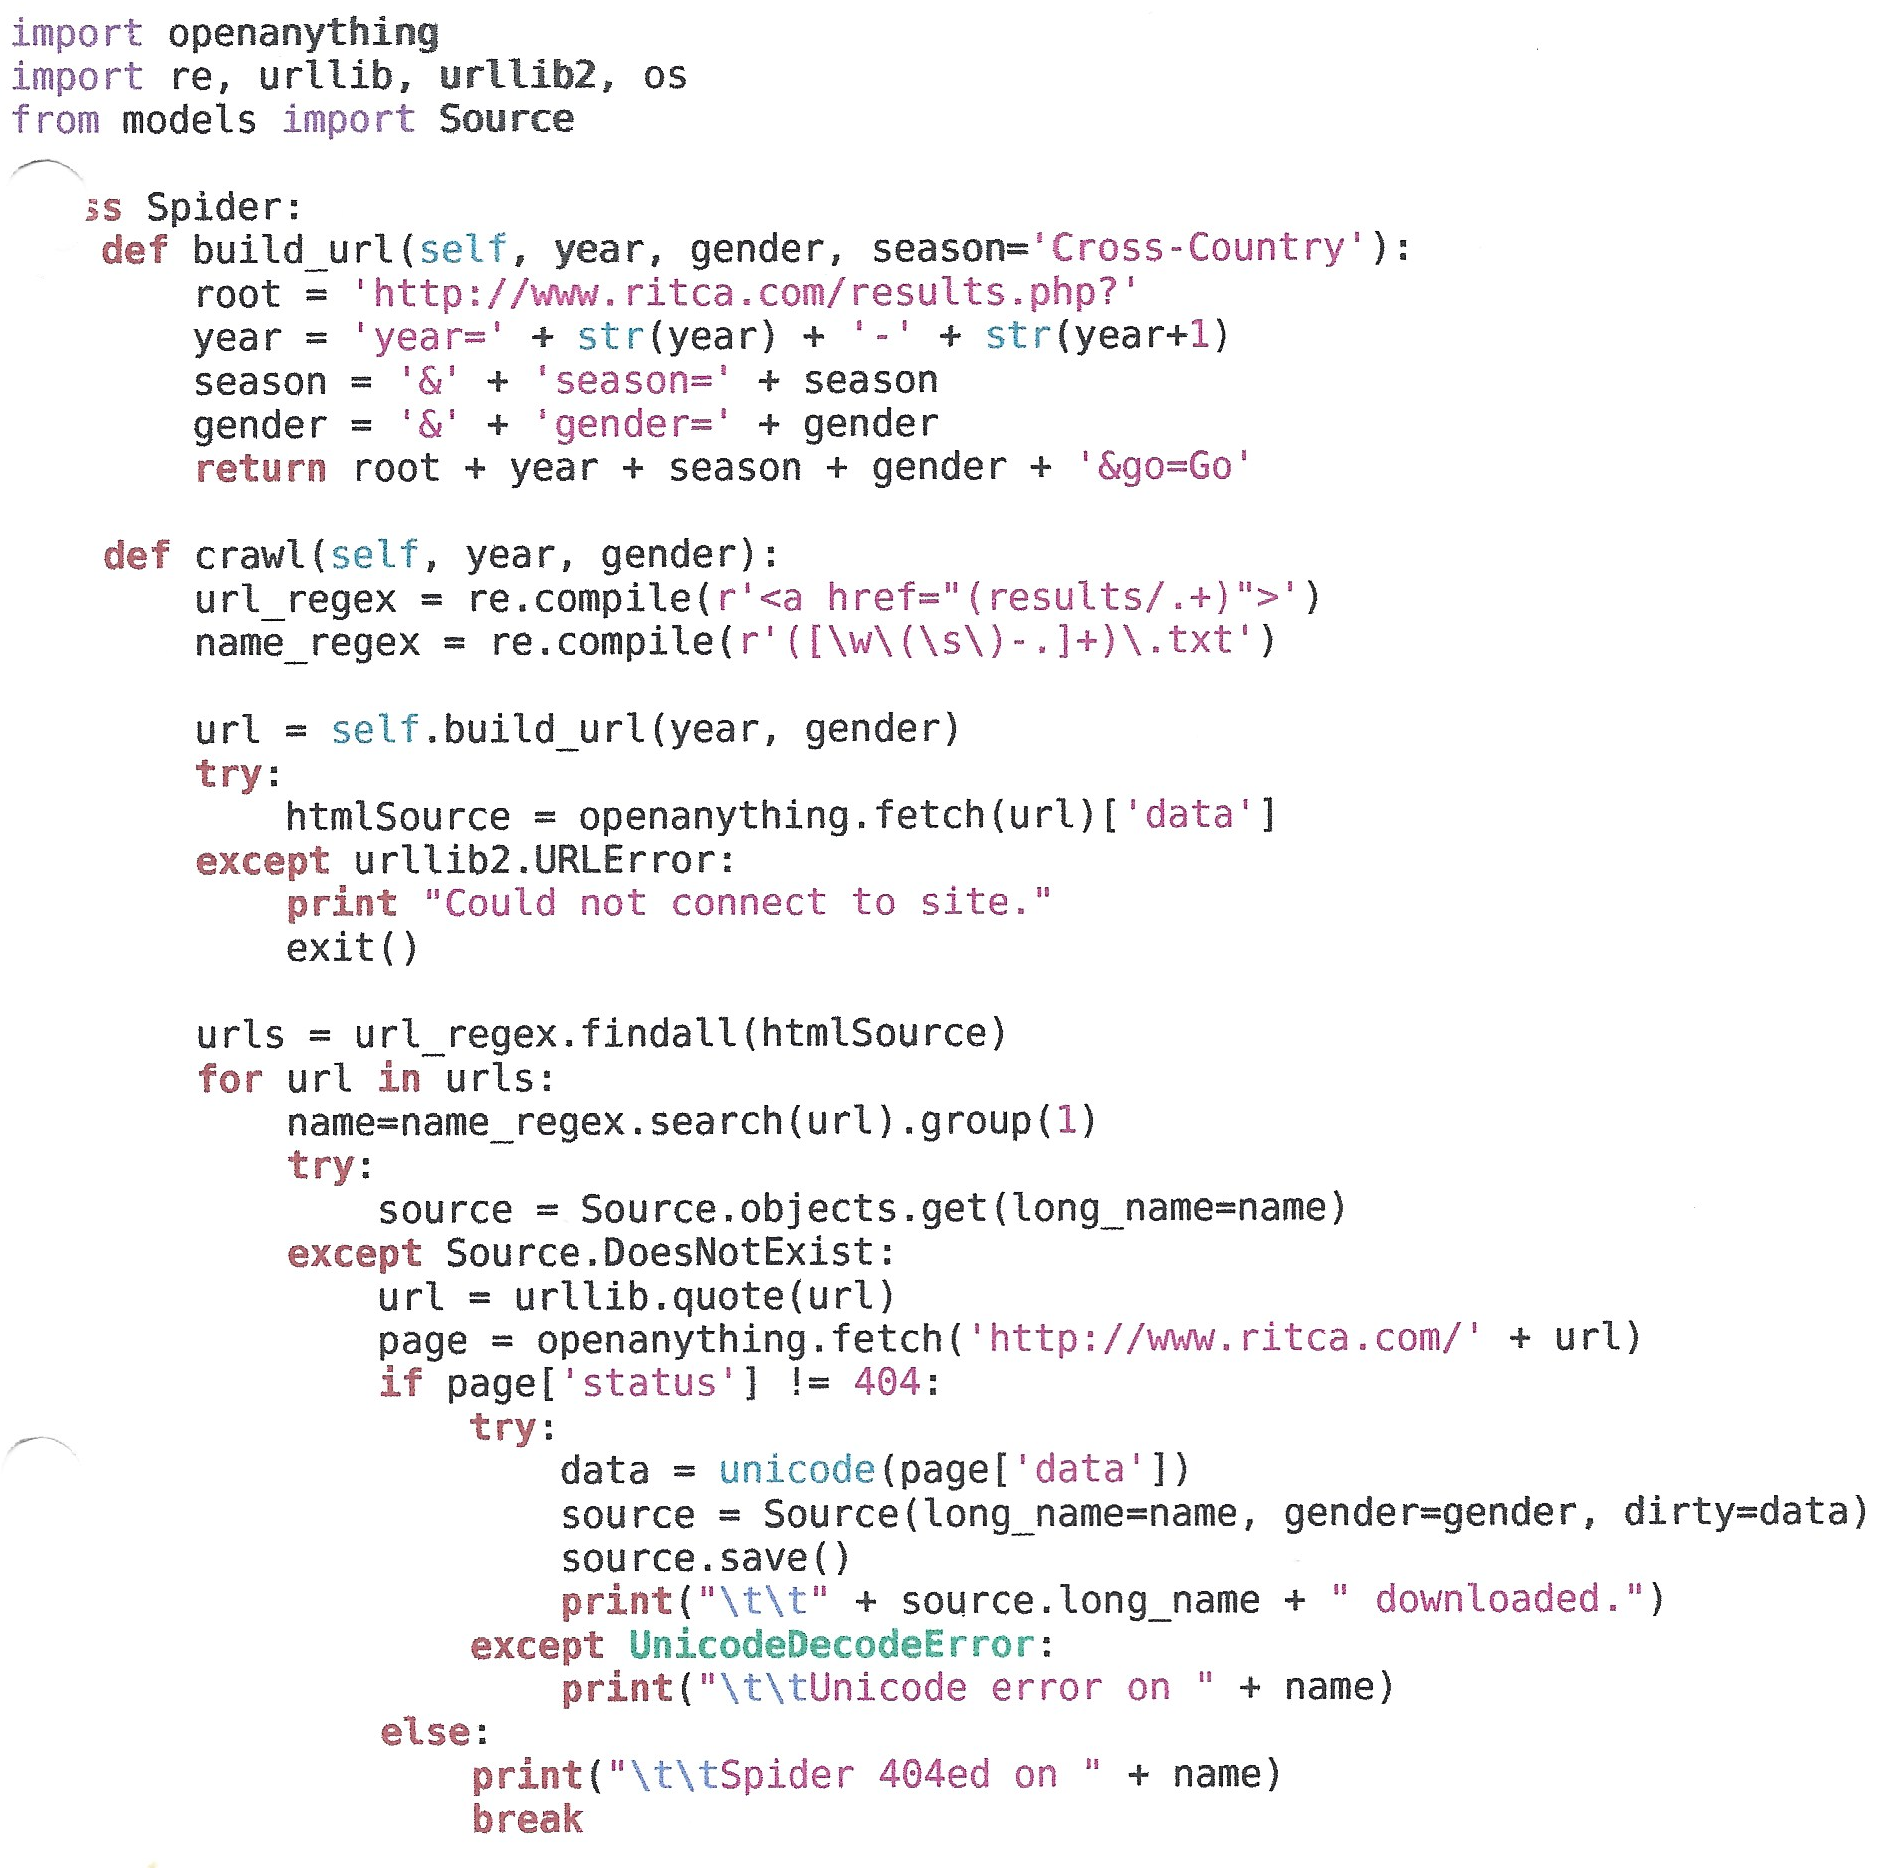
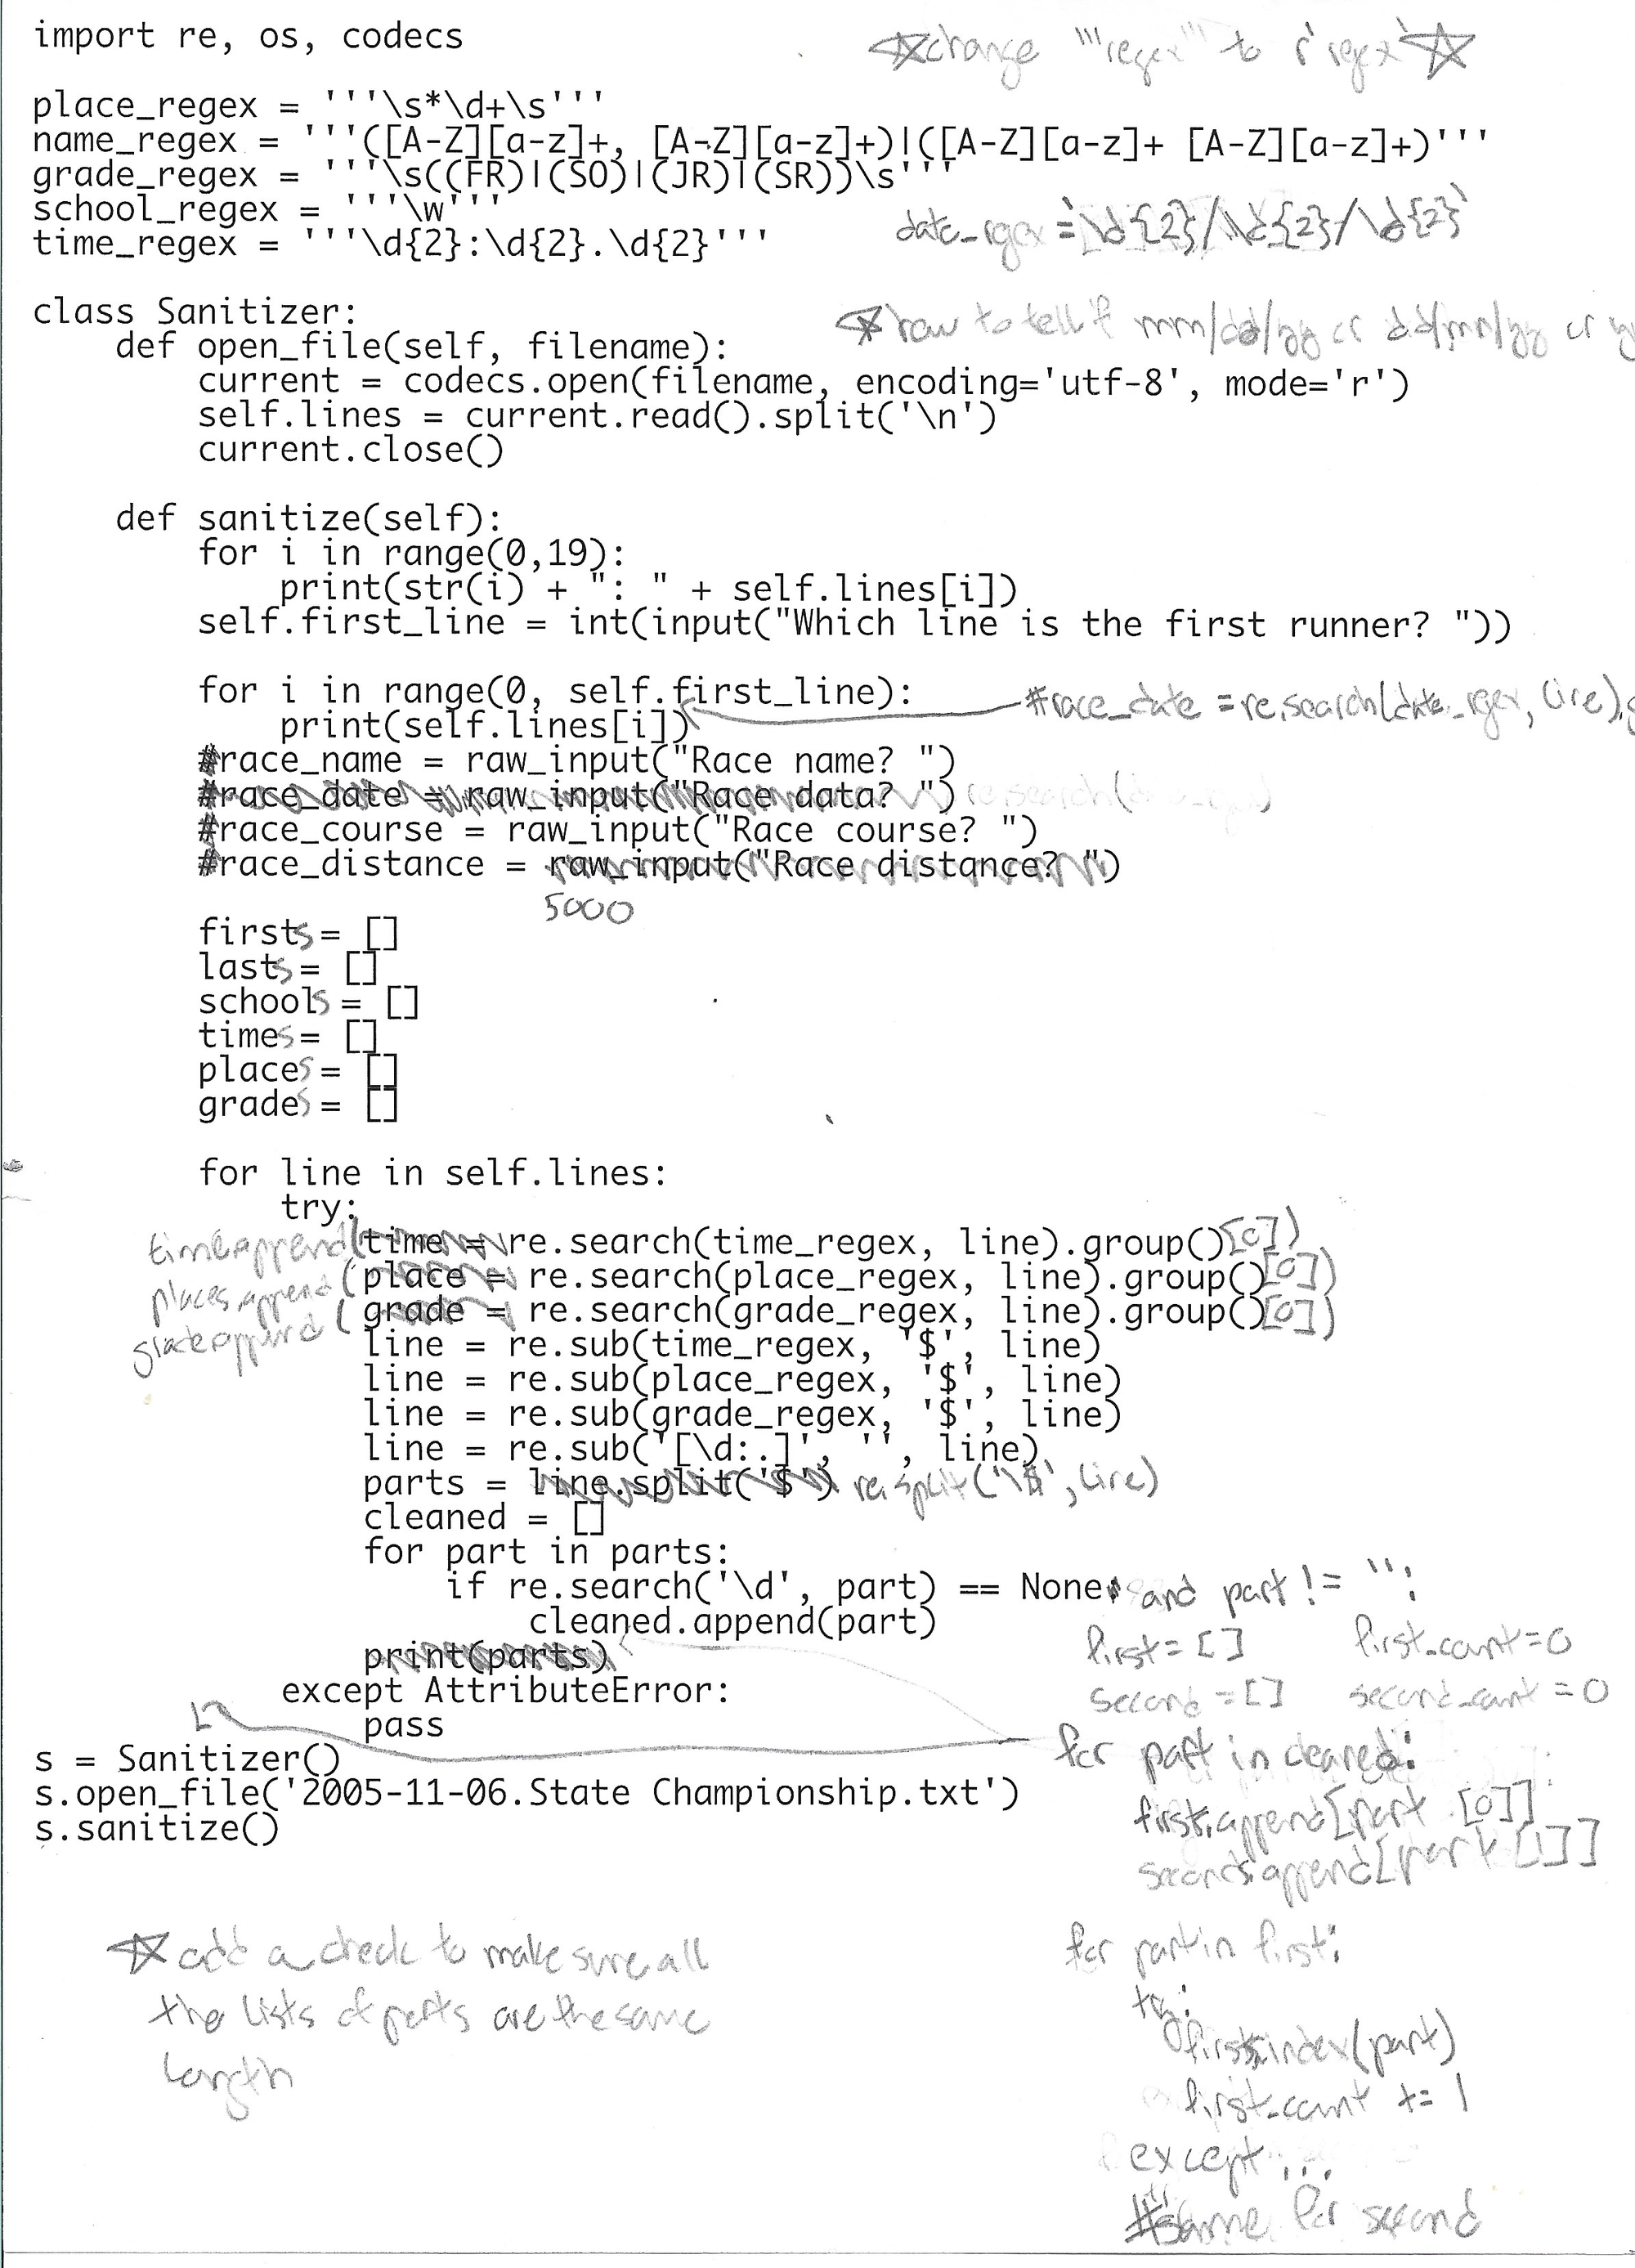
The cursed pieces of this 14 year old code by a self taught high school student:
- In Python 2.7 fstrings did not exist yet, but we did have
.format. I did not know that and concatenated strings instead. - Requests 0.0.1 was only just released at the beginning of 2011, so I used urllib instead. I also mixed usage of urllib 1 and 2.
- I used openanything from the Book Dive Into Python. Beautiful Soup existed, but I didn't know. So I taught myself regex and used those to extract the URLs.
- In Python 2 strings were not unicode by default, so I had to handle unicode conversion.
- Not shown here, but thankfully added later was checking whether I had already downloaded a race result. That way I wouldn't repeatedly hammer the website.
All together the crawler was pretty simple. I later took an information retrieval class and UMass and realized how deep the rabbit hole goes. For now though, I had my race results downloaded.
I made a race results "parser"
My second goals was to "somehow pull all the information from the race results". I didn't know what a parser was at the time, but if it tokenizes like a parser, its a parser.
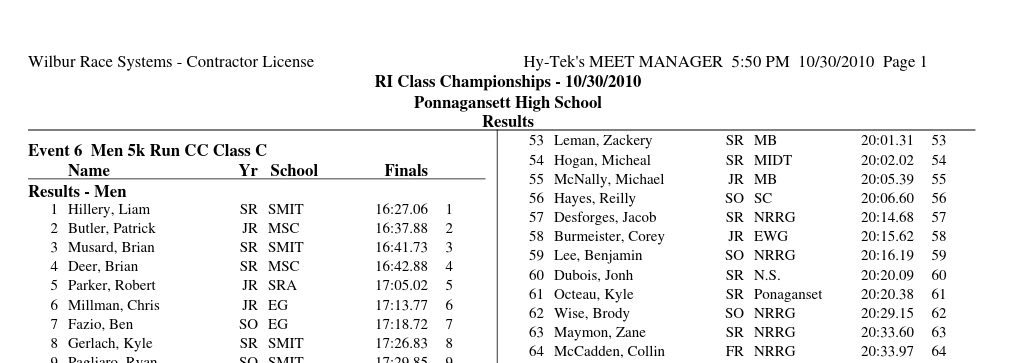
Some race results were a simple .txt file like this:
  Rhode Island Interscholastic LeagueGER  2:05 PM  11/8/2009  Page 1
             RI Cross Country State Championship - 11/8/2009
                          Ponaganset High School
                                 Rankings
  Event 1  Girls 5k Run CC
=======================================================================
    Name                    Year School                  Finals  Points
=======================================================================
  1  #63 Molly Keating        SO La Salle Acad         18:28.01    1
  2   #4 Abigail Jones        JR Barrington            18:54.38    2
  3  #37 Arianna Colella         Cranston West         19:09.34    3
  4   #5 Molly Malinowski     JR Barrington            19:17.45    4
  5   #2 Sarah Barry          SR Barrington            19:20.35    5
Except for the fact that there was several race tracking software out there so the format varied.
The common pieces the results usually had were:
- Header information
- Dividers, often formatted differently
- Rows for each runner
The headers usually provided:
- A date which could be formatted in multiple different ways.
- A race name like "RI Cross Country State Championship"
- An "event" because the software was made to handle track and field which had multiple events.
- Sometimes there would be the distance of the race.
A row typically had:
- The finishing place.
- Sometimes a different number that was the athletes team number. Sometimes that was preceded by a "#"
- Their grade usually as "FR", "SO", "JR" or "SR", but sometimes fully spelled out.
- Sometimes you got "M", "MJR", "MSO", "W", "WJR" and "WSO" because of course.
- Sometimes only some of the athletes had grades and some had just spaces.
- The team the athlete was on.
- Sometimes these would be shortened which mean that you would have different strings for the same team across different race results
- Their First and Last Name. Sometimes names were "Last, First"
- Their finishing time.
- Optionally, the average mile time. Which of course was hard to disambiguate from the finish time.
- Optionally, sometimes the points they scored for their team.
Oh and the order for these columns was sometimes inconsistent.
Results would also sometimes have team rankings:
=================================================================================
Rank Team                      Total    1    2    3    4    5   *6   *7   *8   *9
=================================================================================
   1 Burrillville                 40    2    3    8   12   15   19   23
      Total Time:  1:44:15.00
         Average:    20:51.00
   2 Cumberland                   53    4    7   11   14   17   20   22
      Total Time:  1:46:46.00
         Average:    21:21.20
   3 Pilgrim                      58    1    6    9   18   24   25
      Total Time:  1:49:30.00
         Average:    21:54.00
   4 Mt. St. Charles              65    5   10   13   16   21
      Total Time:  1:48:33.00
         Average:    21:42.60
These would sometimes randomly appear at either the top or the bottom of the results file.
sometimes, sometimes, sometimes
As you can imagine this was all immensely cursed to handle. The parsing was extra cursed because of the existence of PDFs. Some race results came as PDFs and often those PDFs would have a two column format like this:
I remember that I converted the PDFs to txt first before processing. I do not remember the specifics, but I do know that the output formatting left a lot to be desired.
Anyways, when all you have is a hammer regex, everything is a string:
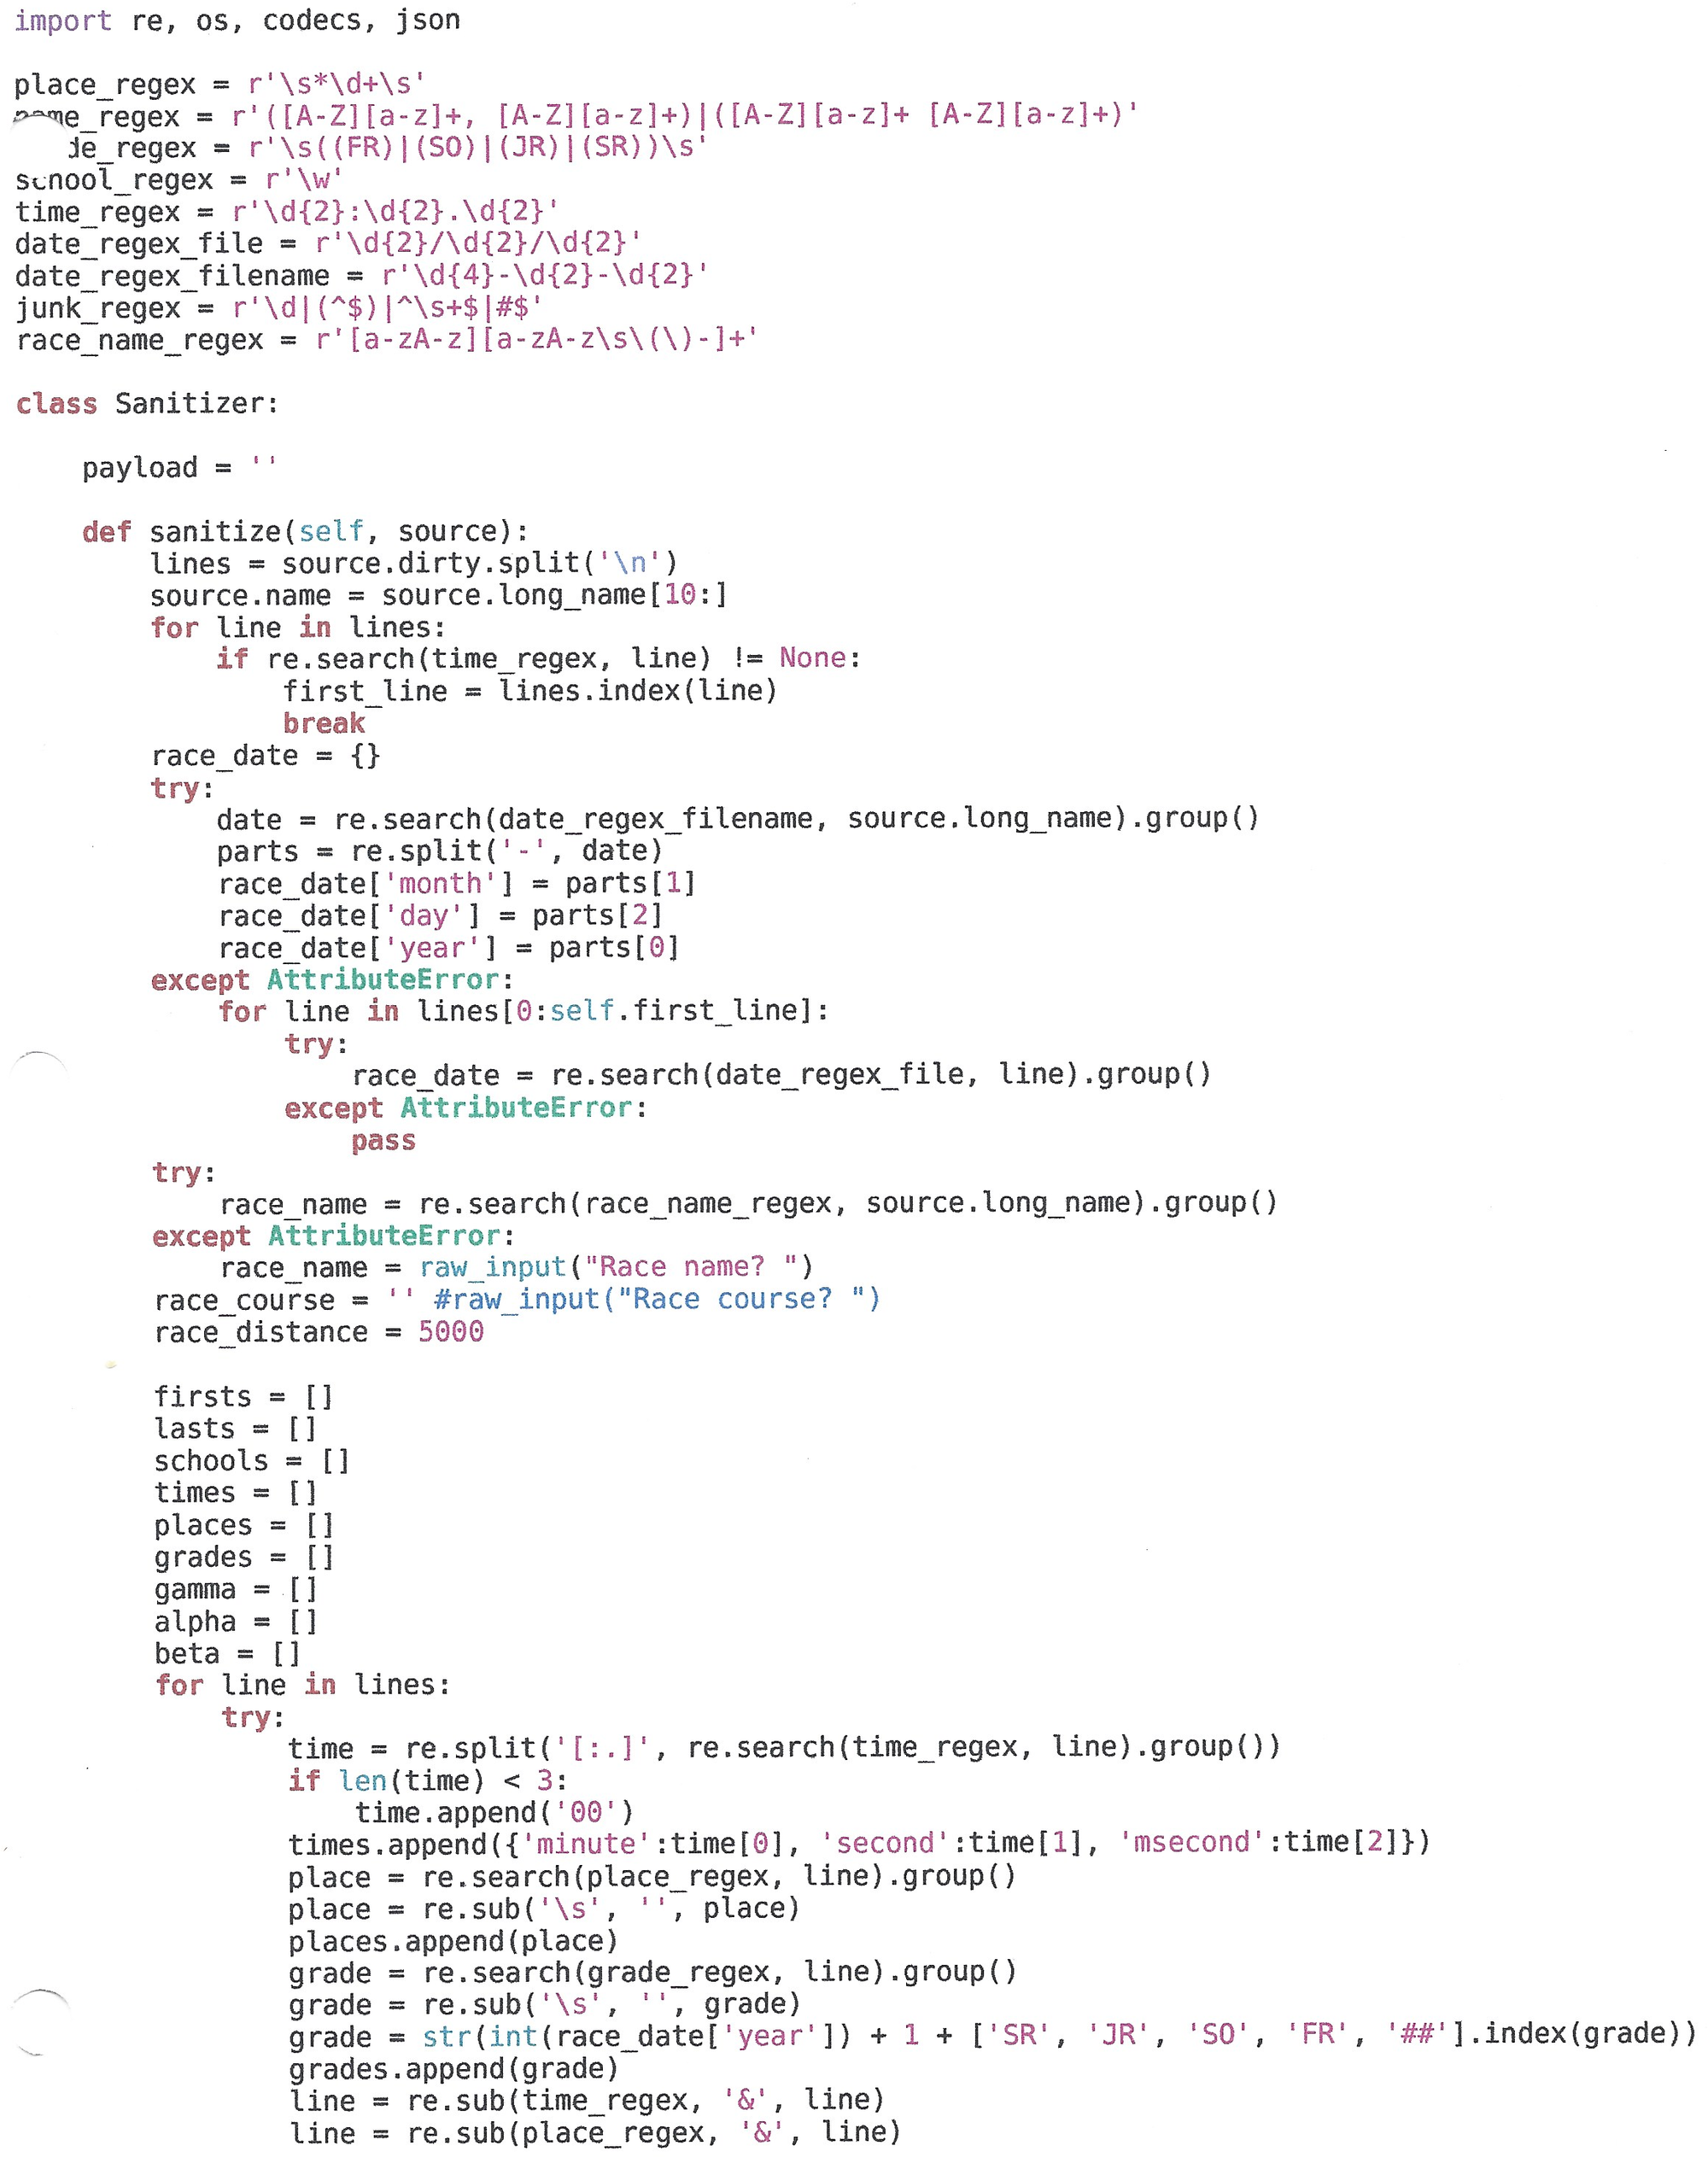
Some thoughts:
- This is an early version of the code. I doesn't cover all the edge cases I eventually got to. You can image the extra layers of nested conditionals that were required.
- One thing that would have really made this more manageable are unit/regression tests. I could take a file that demonstrates each edge case and write a test. Of course I did not know about testing at this point.
- No type annotations makes this a little harder to read. For example what type is the
sourceparam? Probably just a string, but who knows what weird stuff I did. - Figuring out what is the first runner row after the header was tricky.
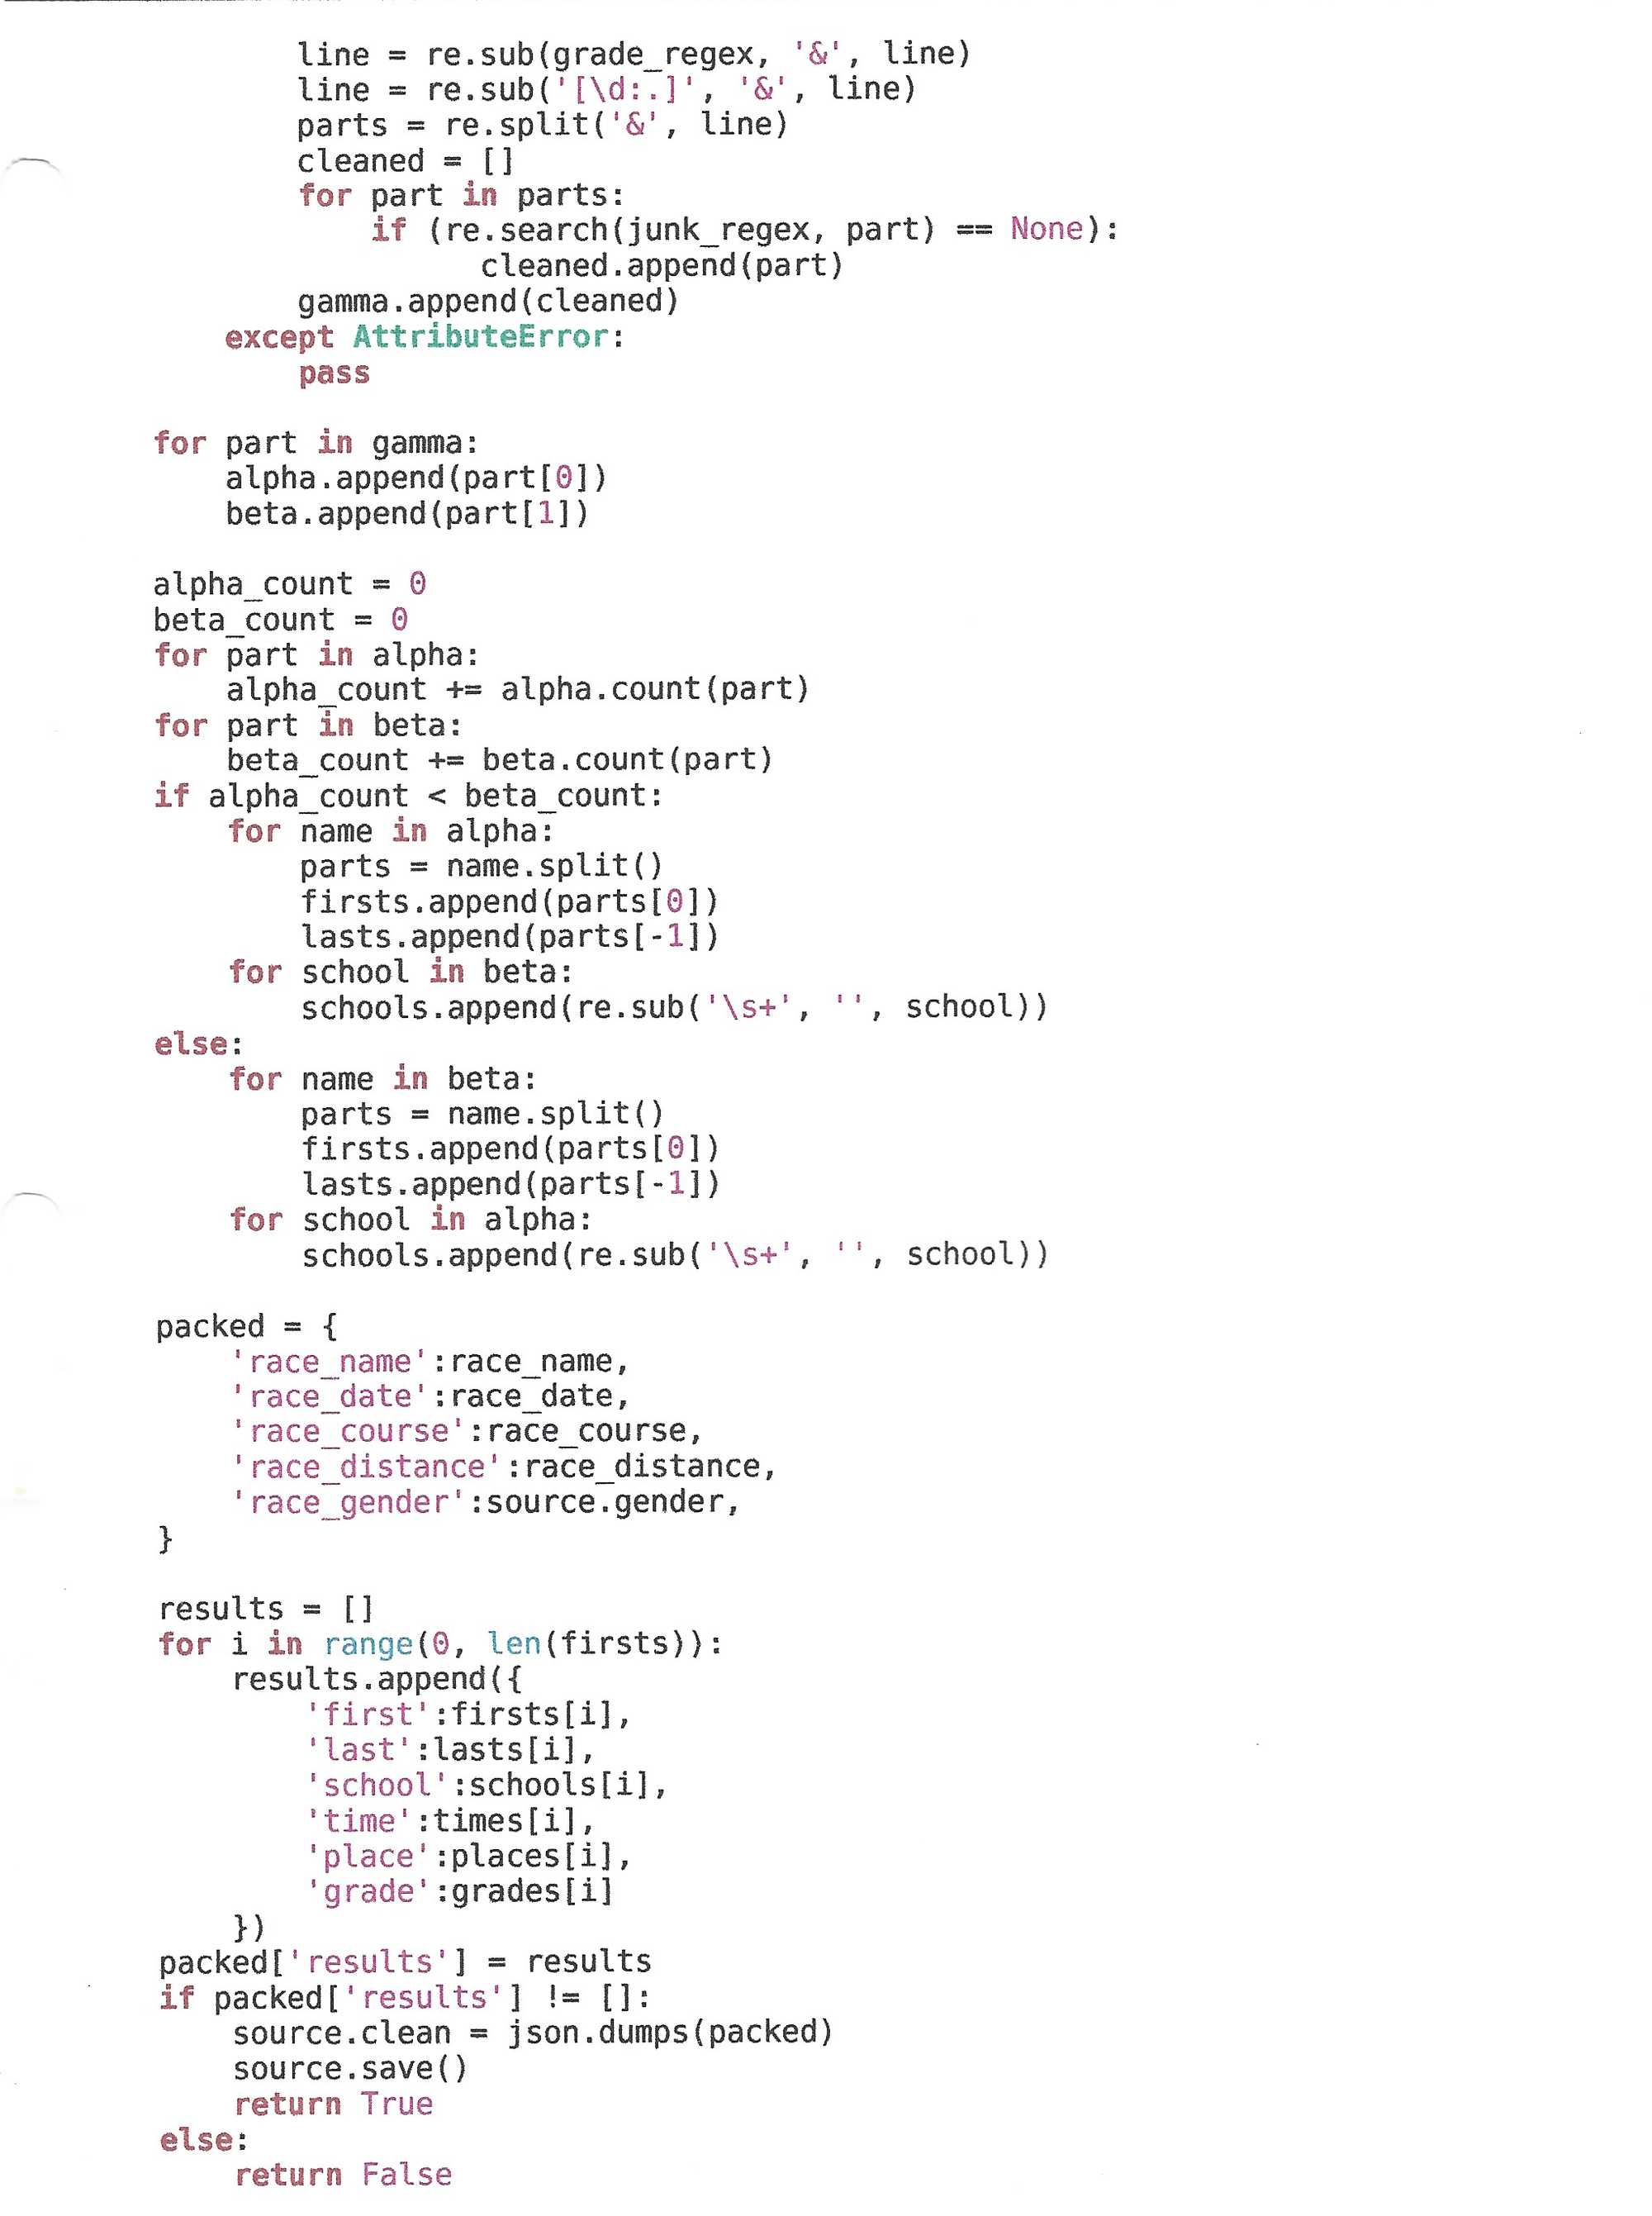
More thoughts:
- You can see the point where my brain broke and I began using alpha, beta and gamma as metasyntactic variables.
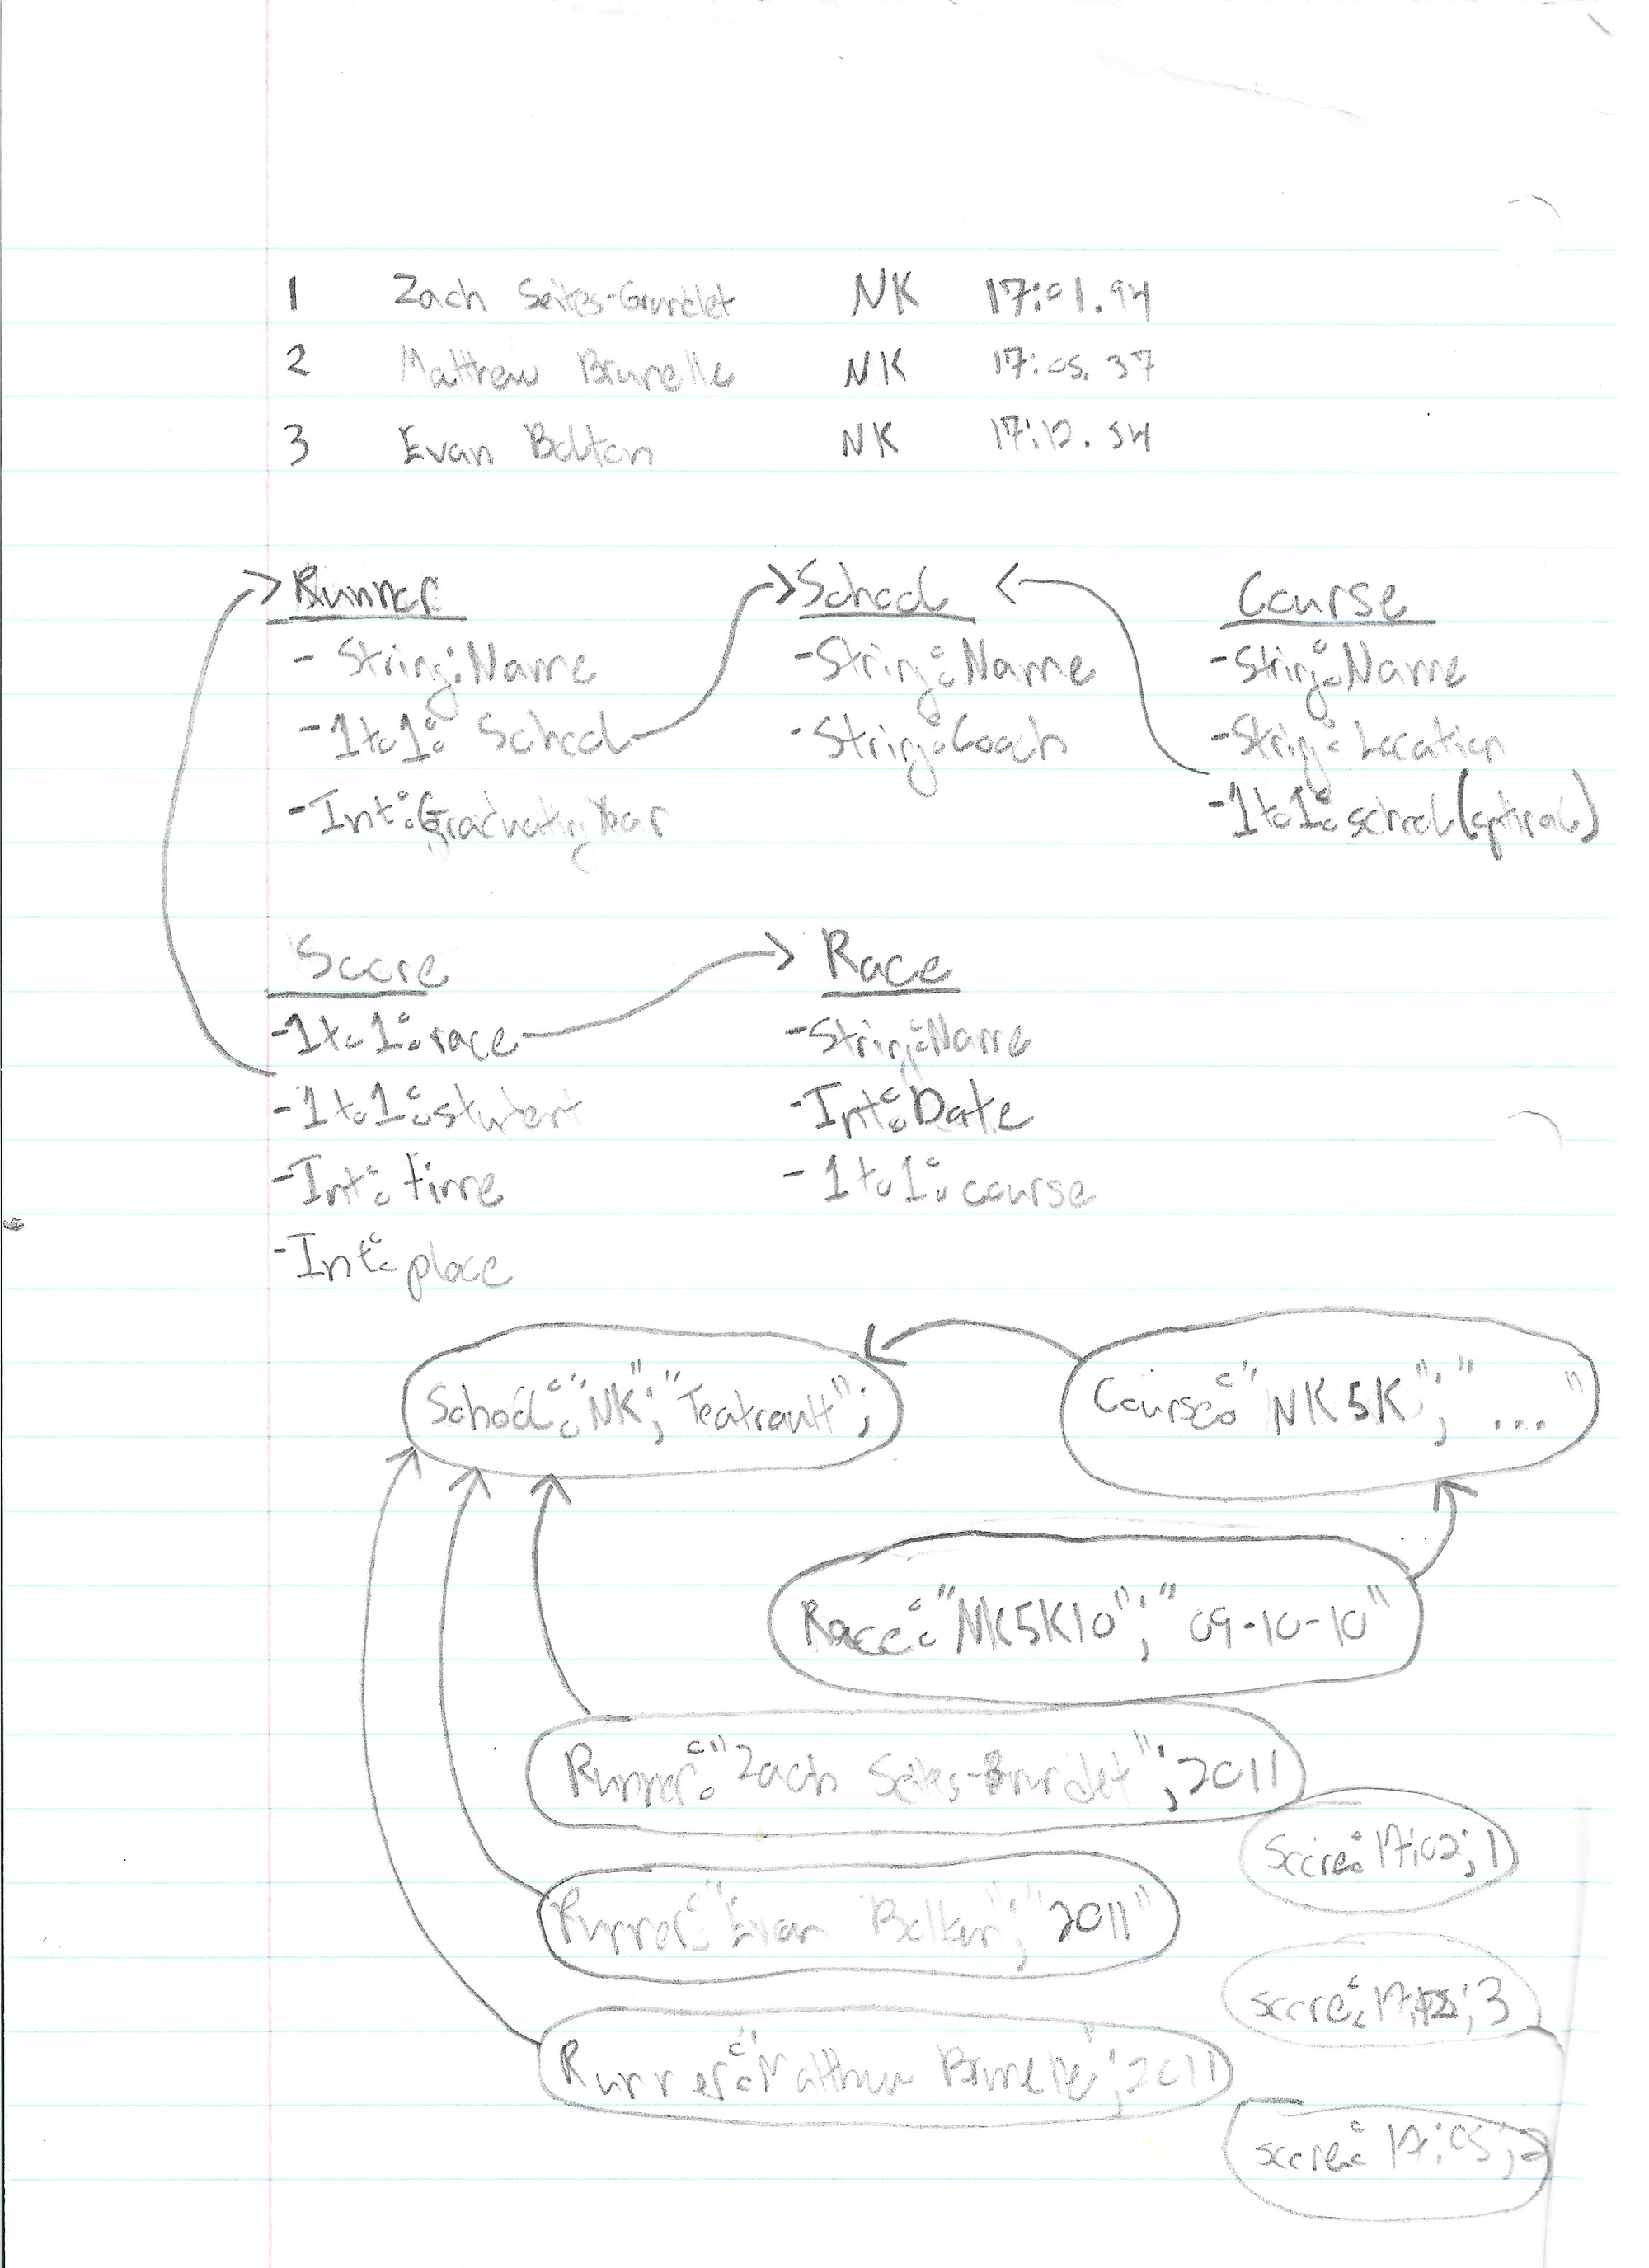
The rest of the pipeline code handled CRUD operations for loading everything into the DB. This was also cursed because I never learned the fundamentals of relational DBs as a kid... so I used MongoDB. I though SQL was hard! Despite choosing to use a non-relational DB, I seemed to have drawn an entity-relationship model without knowing what one was:
With the pipeline all done I now had a dataset I could work with.
On the power of asking for help
Now I needed to "somehow analyze all the race results".
As a starting point I recalled that my coach used VDOTs to help us with training. VDOT is a Jack Daniels Running Method specific metric. He use the race times and known VO2Max of runners to create regressions. Then he published a table in Oxygen Power. Performance Tables for Distance Runners for easily looking up an estimated VO2Max based on race times. [^ You could to use race times or all out efforts, because the method was based on the assumption that athletes were performing at maximal effort.]
What is VO2Max? I'll defer to others for an explanation. The Tread Lightly podcast has a great practical episode on vo2max and how it relates to running. [^ Here are some other good podcasts https://blog.matthewbrunelle.com/what-podcasts-am-i-listening-to-2025/] Marco Altini often writes about the technical details of vo2max and bioinformatics. To this day I really love the topic and do bioinformatic personal projects that never see the light of day.
The key piece relating to my first project was that it sounded like I could use a race time to calculate a VDOT. How though?
I searched online and found a vdot calculator [^ No longer up, but thankfully in the wayback machine] that used (1) the distance and (2) time to estimate your vdot. I then reached out to the author Tom Fangrow and used the greatest power that a high school student has: showing an earnest interest in actually learning. I got back a very kind and detailed response, including formulas and hand drawn visualizations! Here are the details, with Tom's permission:
[^ Sadly, ghost does not support latex, so no pretty equations here.]
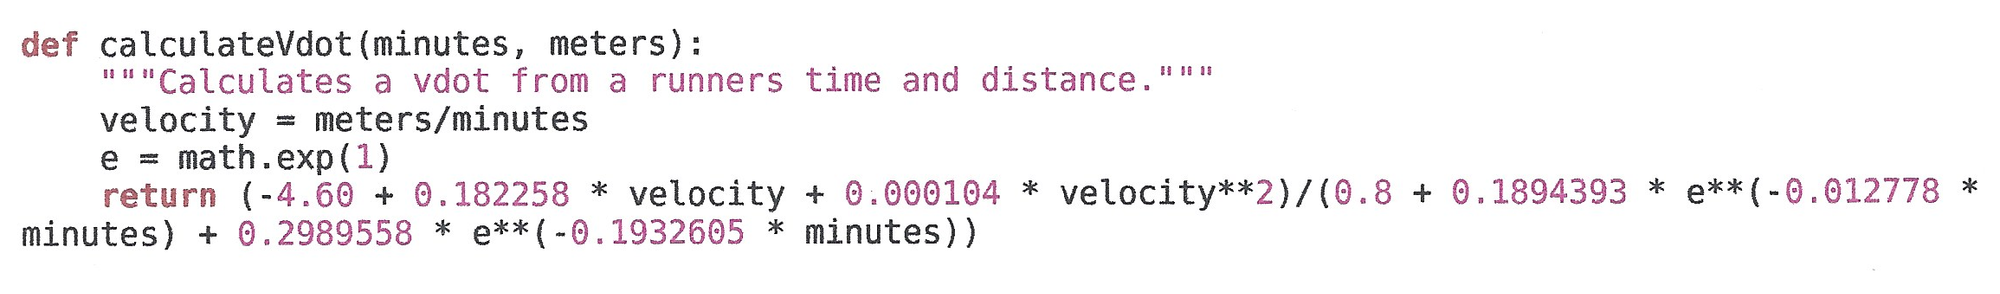
These are the two equations (where c=oxygen consumption,i=% of maximum effort,v=velocity, d=distance, t=time).
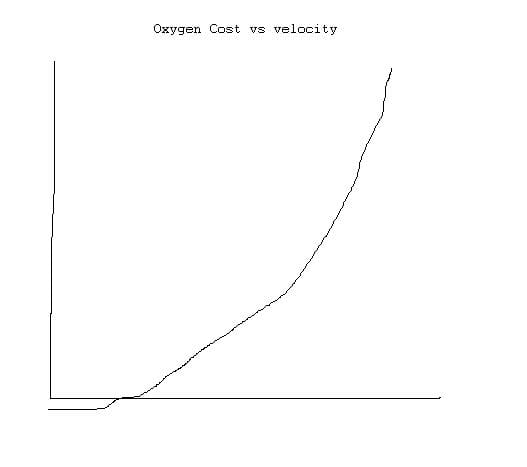
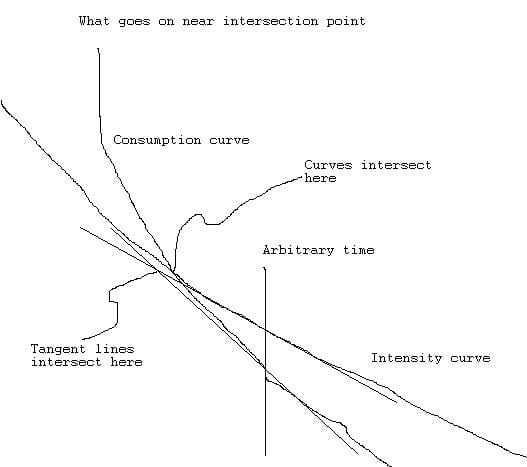
The first one, c=-4.6+.182258v+.000104v*v, gives oxygen consumption as a function of running velocity. The curve has a parabolic shape:
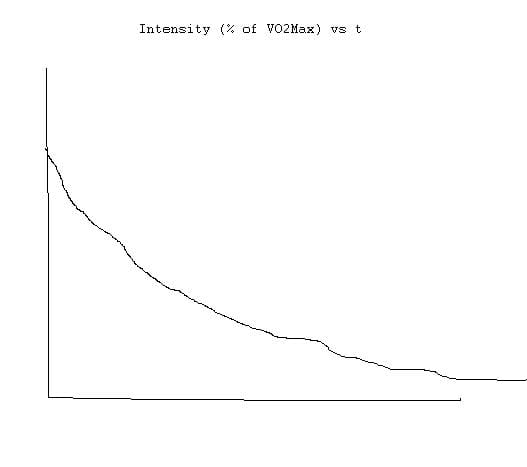
The second equation,i=.8+.1894393Math.exp(-.012778t)+.2989558Math.exp(-.1932605t), gives % of maximum effort as a function of running time. The shape of this curve is an exponential decay:
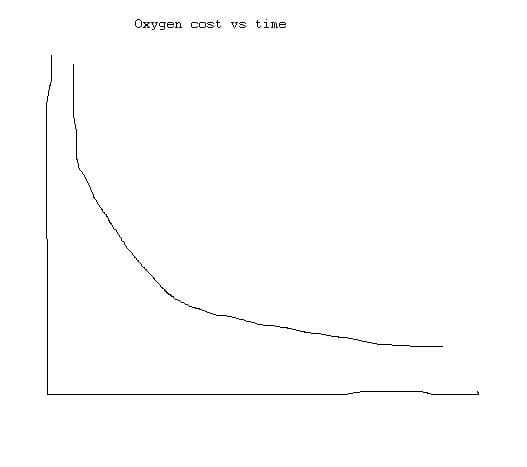
For me, the key to understanding the whole thing was to get both equations in the same form, namely oxygen consumption vs time. In the case of the first equation, that means changing v to d/t to get c=-4.6+.182258d/t+.000104d*d/t/t. In order to work with this, d has to be a constant. Then the curve takes the 1/x shape:
The second equation is already in terms of t. The key here was to realize that the oxygen consumption is just some constant (in this case VDOT) multiplied by i, the % of maximum effort.
Now for any distance, both curves can be drawn on the same graph of oxygen consumption vs time. The place where the curves intersect is the time it takes a runner to cover a distance as quickly as possible. When you normalize this (add a constant to make the numbers match the actual measured time), you get a constant (VDOT) that can be used for other distances as well. Since the constant was based on what the runner thought was his maximum effort, it includes everything - not just his fitness level, but also his mechanical efficiency, tolerance for pain, even his level of motivation. I think that’s pretty cool. These guys were really smart for figuring this out! [^ A kindred spirit! I also think this is immensely cool.]
In order to find out where the curves intersect, I used repetitive approximations to converge on the answer. I think it is called Newton’s method, but I’m not sure. All you have to do is come up with a reasonable first guess (I used t=d*.004 which corresponds to a running speed of 250 meters per minute), then plug this time into both equations and see what the difference is. I called the difference e=absolute value(c-ivdot), and I stopped the iterations when e became less than .1 ml per minute.
>
The next step is to (painstakingly) take the time derivative of each function, then define a correction dt=(c-ivdot)/(dc-di*vdot). Set t=t-dt, and start the next iteration. That must have been the way Daniels did it also, because my values match his values to within a couple of seconds for distances ranging from 1 lap around a track all the way to a marathon, and from athletes with VDOT values ranging from 30 to 80.I hope you got something out of this explanation.
I really want to express how meaningful this was to me as a kid. For someone take the time to lay everything out so clearly. The type of kindness the worlds needs more of.
Thinking through the analysis
My binder for the project portfolio had some fun papers. Often when I was in class I would stop taking notes, and start writing ideas for my project. So you would see English notes that transitioned into pseudo code. Obviously the project was more fun to work on then my classes.
Also, since you didn't have a computer with you in school in 2011 I couldn't edit my code while ignoring my classes. So like some kind of maniac, I would print out code in the morning before class, editing during school, and then make the updates when I got home:
Anyway, there is lots of documentation about my thought process. I had a theory that in a race, runners finish times would follow a normal distribution:
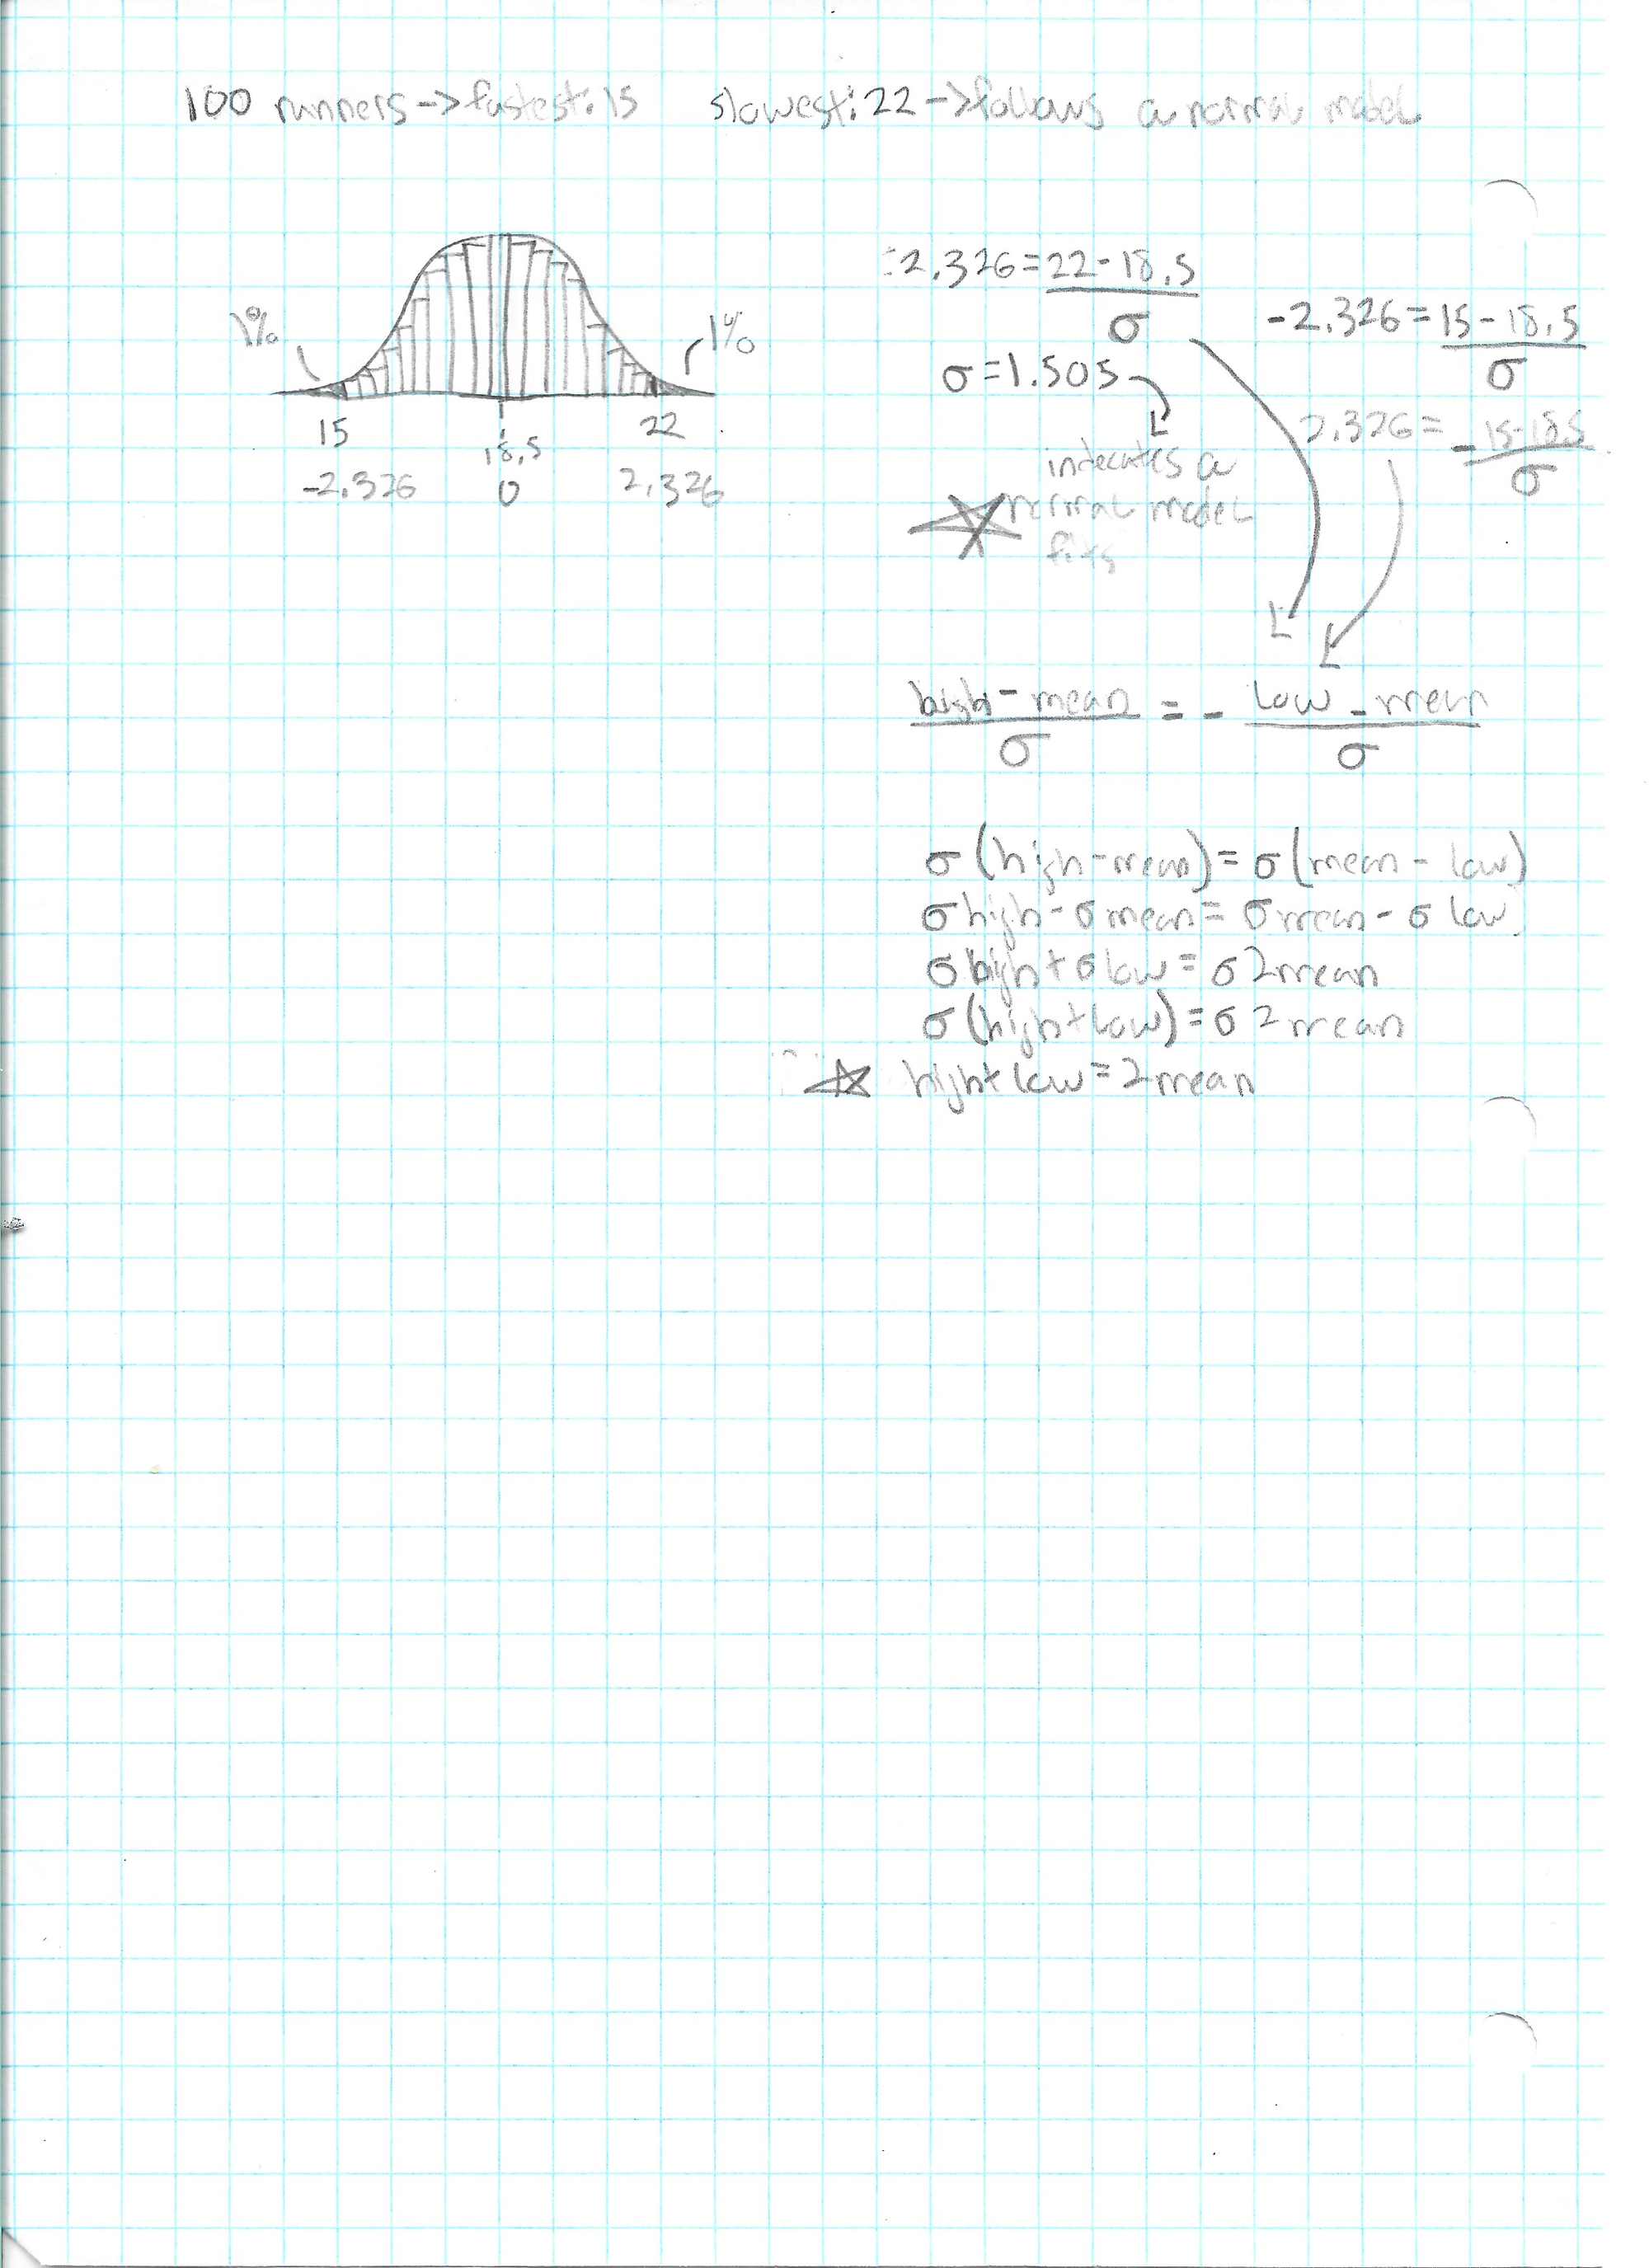
The truth is that they are actually log-normal due to a right skew. I was still in AP Statistics at the time and I don't think I had gotten to that yet. [^ As a side note, I had a pretty bad Spanish teacher my junior year. When I found out I was assigned to her again senior yet, I met with my councilor and got approval to drop the class and take AP Statistics instead.]
I also thought that a runner's improvement to their VDOT would follow a logarithmic regression over time:
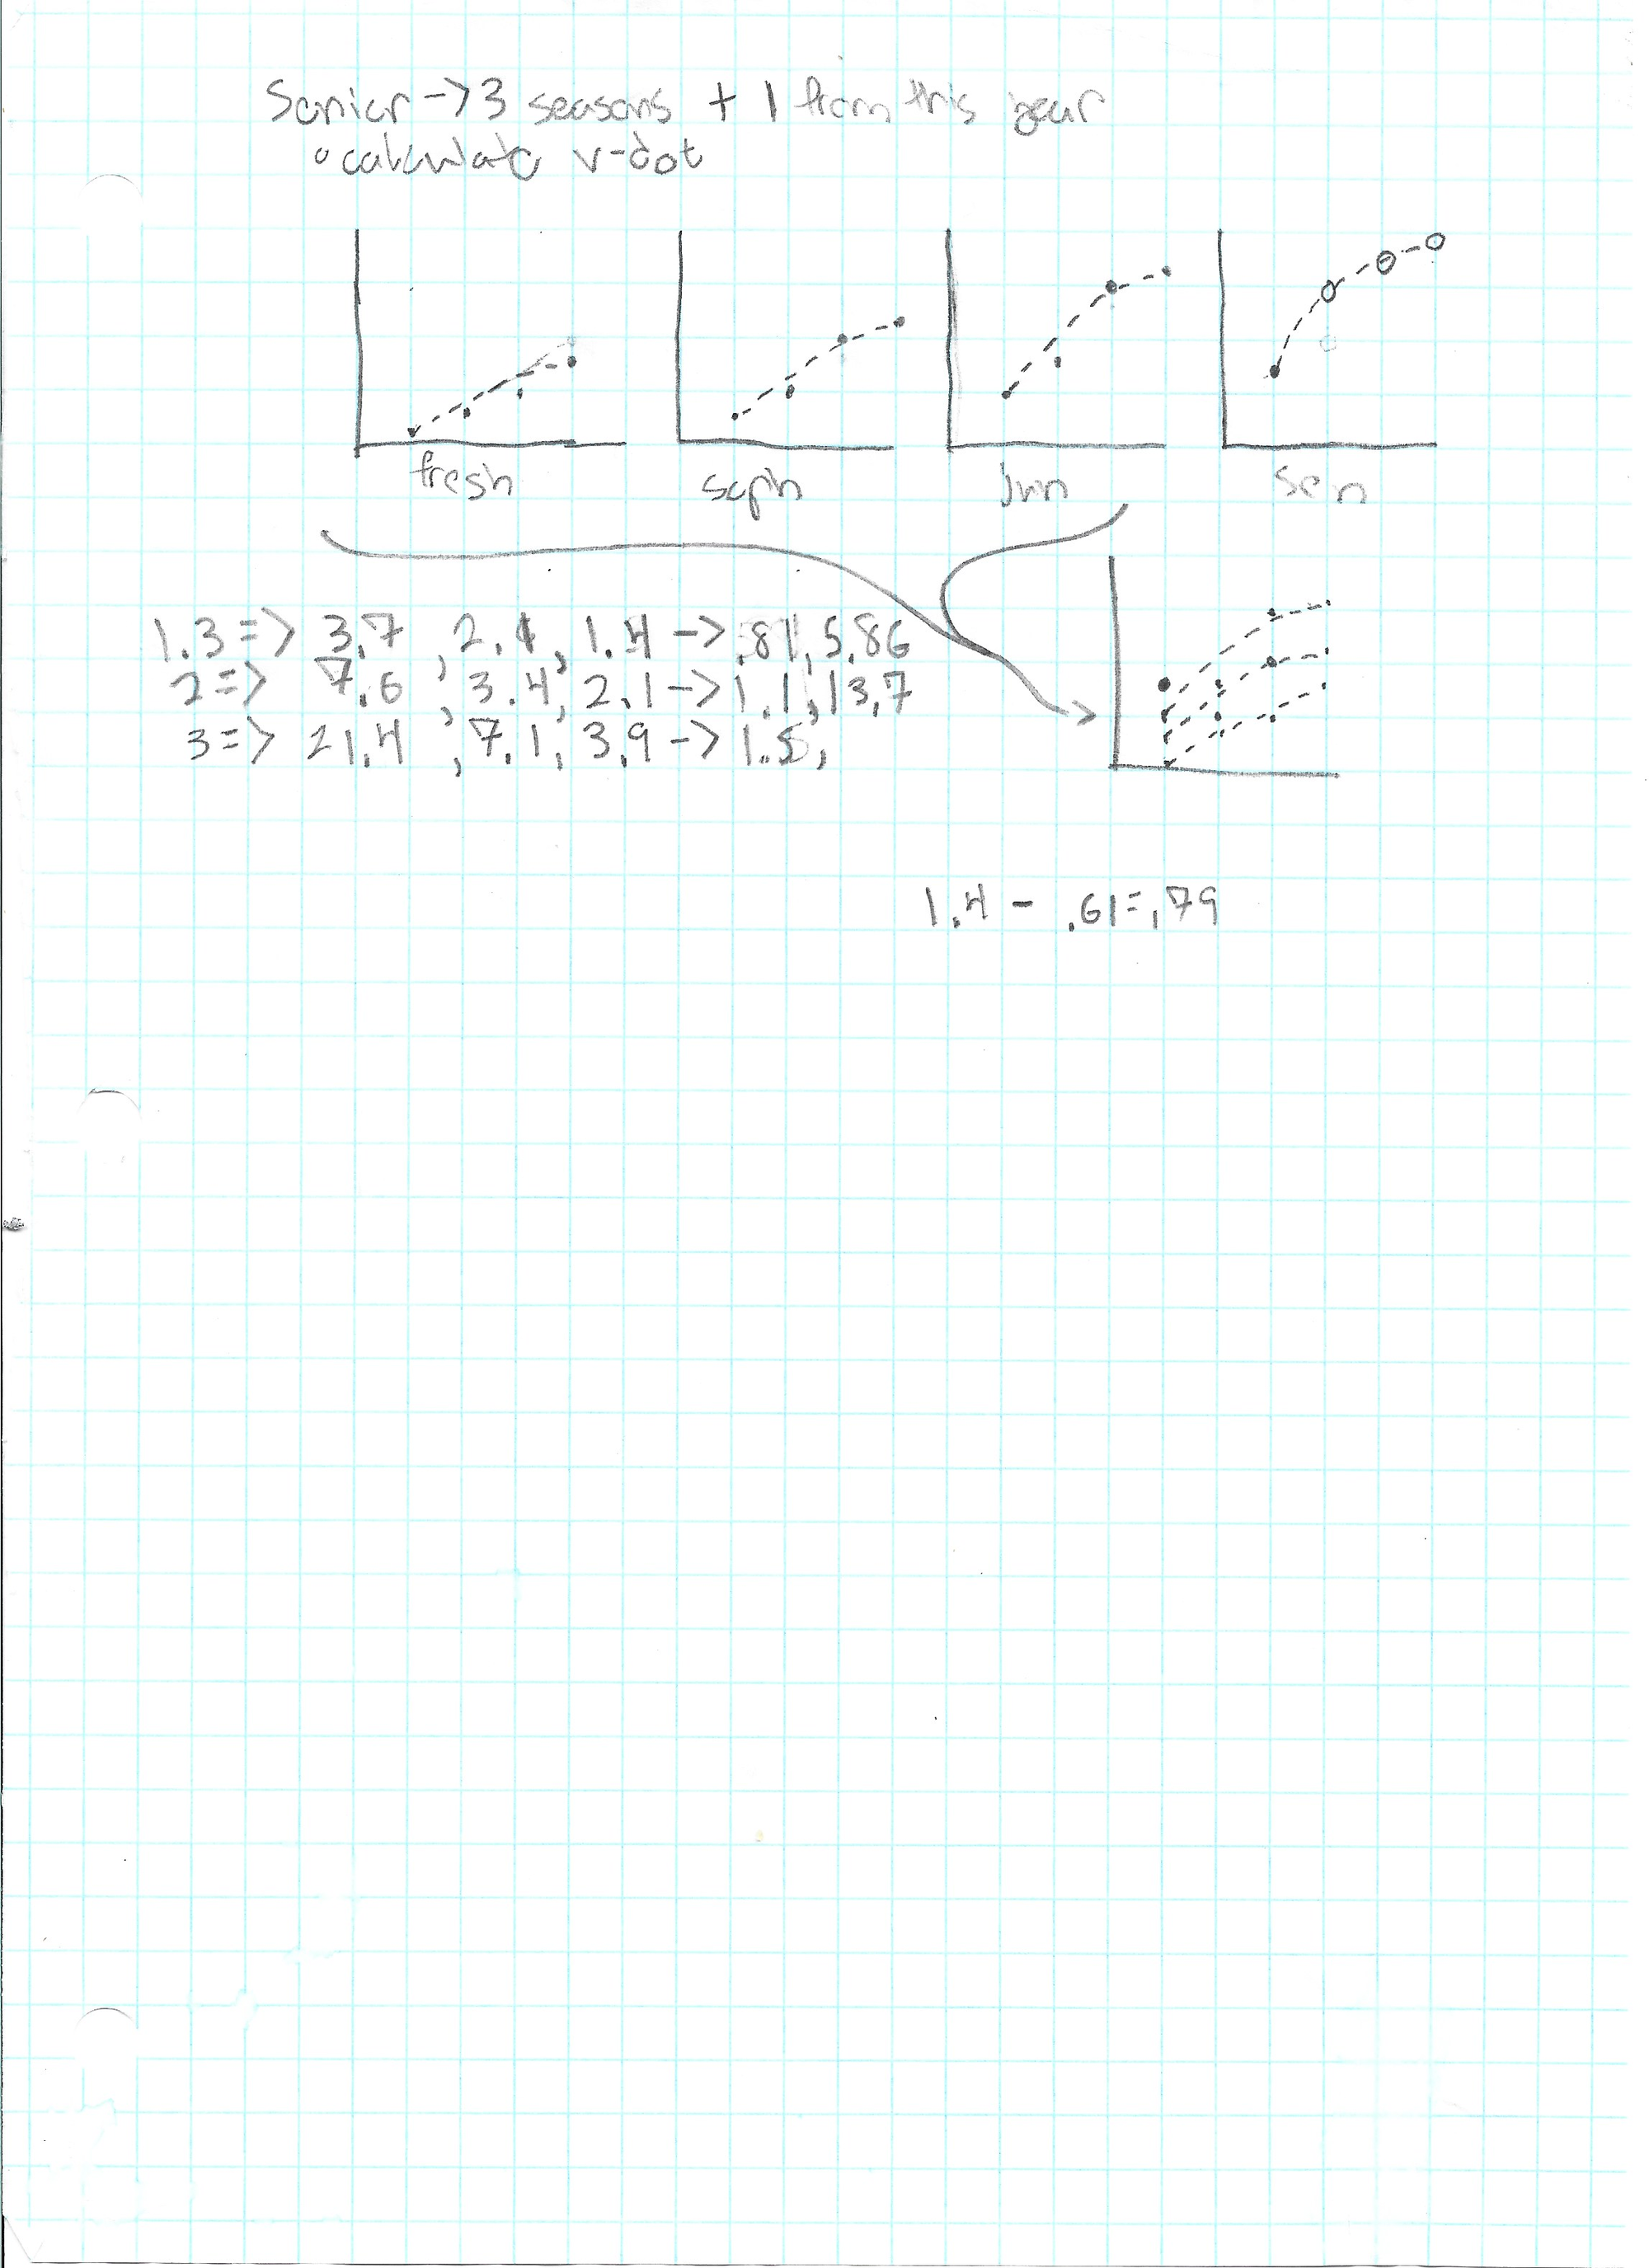
I do not know if this has been formally show, but the race results seemed to match.
The first version of Python notebooks were only just released in 2011 and I had not heard of them. So I made many one off scripts to test out my ideas. After all the experimentation I had an idea of what to do.
I made a data pipeline
I was now armed with ideas and the following code:
I had two types of analysis I wanted to do:
- Can we predict how a runner will do in the future?
- How did a runner do in a particular race?
The tricky thing about the first question is that cross-country has a yearly season and many runners do not do indoor / outdoor in the off season. A runner's VDOT would likely drop during the off season and then return to the expected curve in the next season. I decided to rephrase the first question as "can I predict how a runner will improve this current season?"
So I needed to segment each athletes races into yearly seasons and perform regressions over each season. I then wanted to see if a prior seasons regression could be used to inform how a current season might progress. I was toying with the idea assuming a runner might follow a similar curve each season, but with a different starting point. That meant I could use the first race or two plus a prior seasons curve as an estimate.
I managed to get the following plumbing in place:
- For each runner, calculate their VDOTs for every race.
- Segment a runner's races into season.
- For each season create a logarithmic regression of the VDOTs over time.
By the time the project was due I didn't have the final piece in place, so I settled on a simpler approach of just using the races in a current season to make a regression and use that as an estimate.
As for the second analysis I did the following:
- For every runner in each race, calculate their VDOTs
- For each race, calculate the mean and standard deviation of the runners' VDOTs
- Us the z-score to explain how the runner did in terms of percentiles.
Looking at this now, I could probable have dropped the VDOT in this part and just used the runners finish time since we are only comparing runners withing the same race.
I am proud of this analysis work, but also a little disappointed since this is the weakest piece of the project. However, I didn't have many tools in my toolbox yet for this kind of work. I wouldn't take a Knowledge Discovery class and learn more until I attended UMass.
I made a Django Site
So far I've laid these sections out like they happened one at a time. In truth I did the scraping, sanitation, analysis and presentation together as a I went. Each piece informing changes to the others. I had read Rework and the term "MVP" was echoing in my ears. So armed with my Django 1.0 book I set out to make a site.
I started with some wire framing:
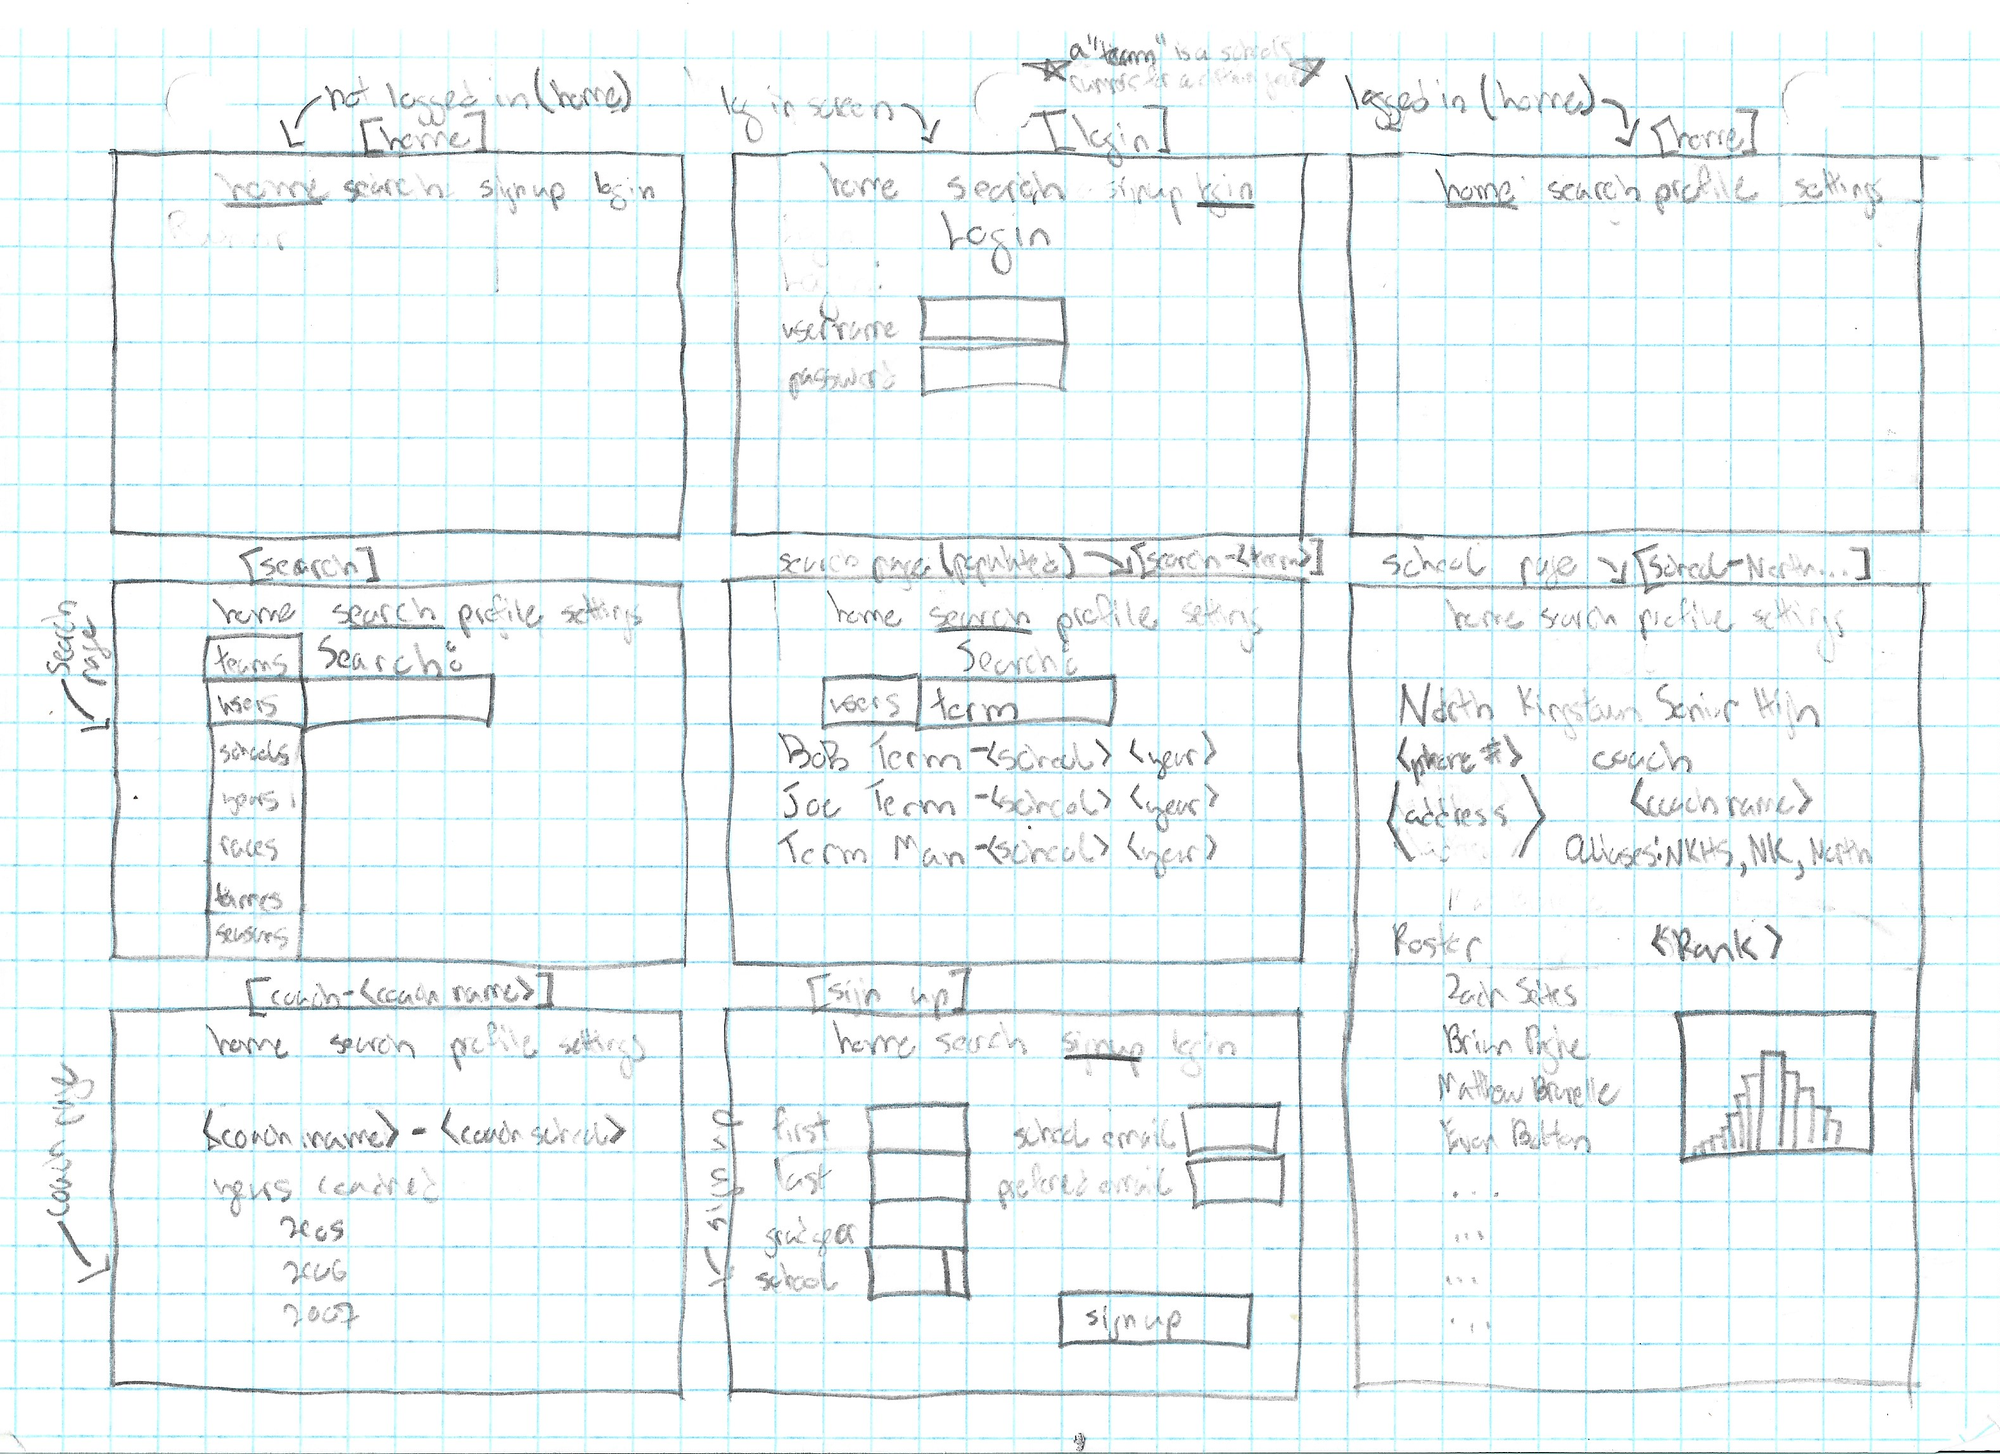
Design was not, and still is not, my forte. So the site was mostly a one to one mapping of the core data model.
The webpages were not backed up in the wayback machine and without the code I can't recreate the web page. However, I printed out some pages for my portfolio. Sadly, I made many updates after these screenshots were taken, but we won't be able to see those changes.
The home page:
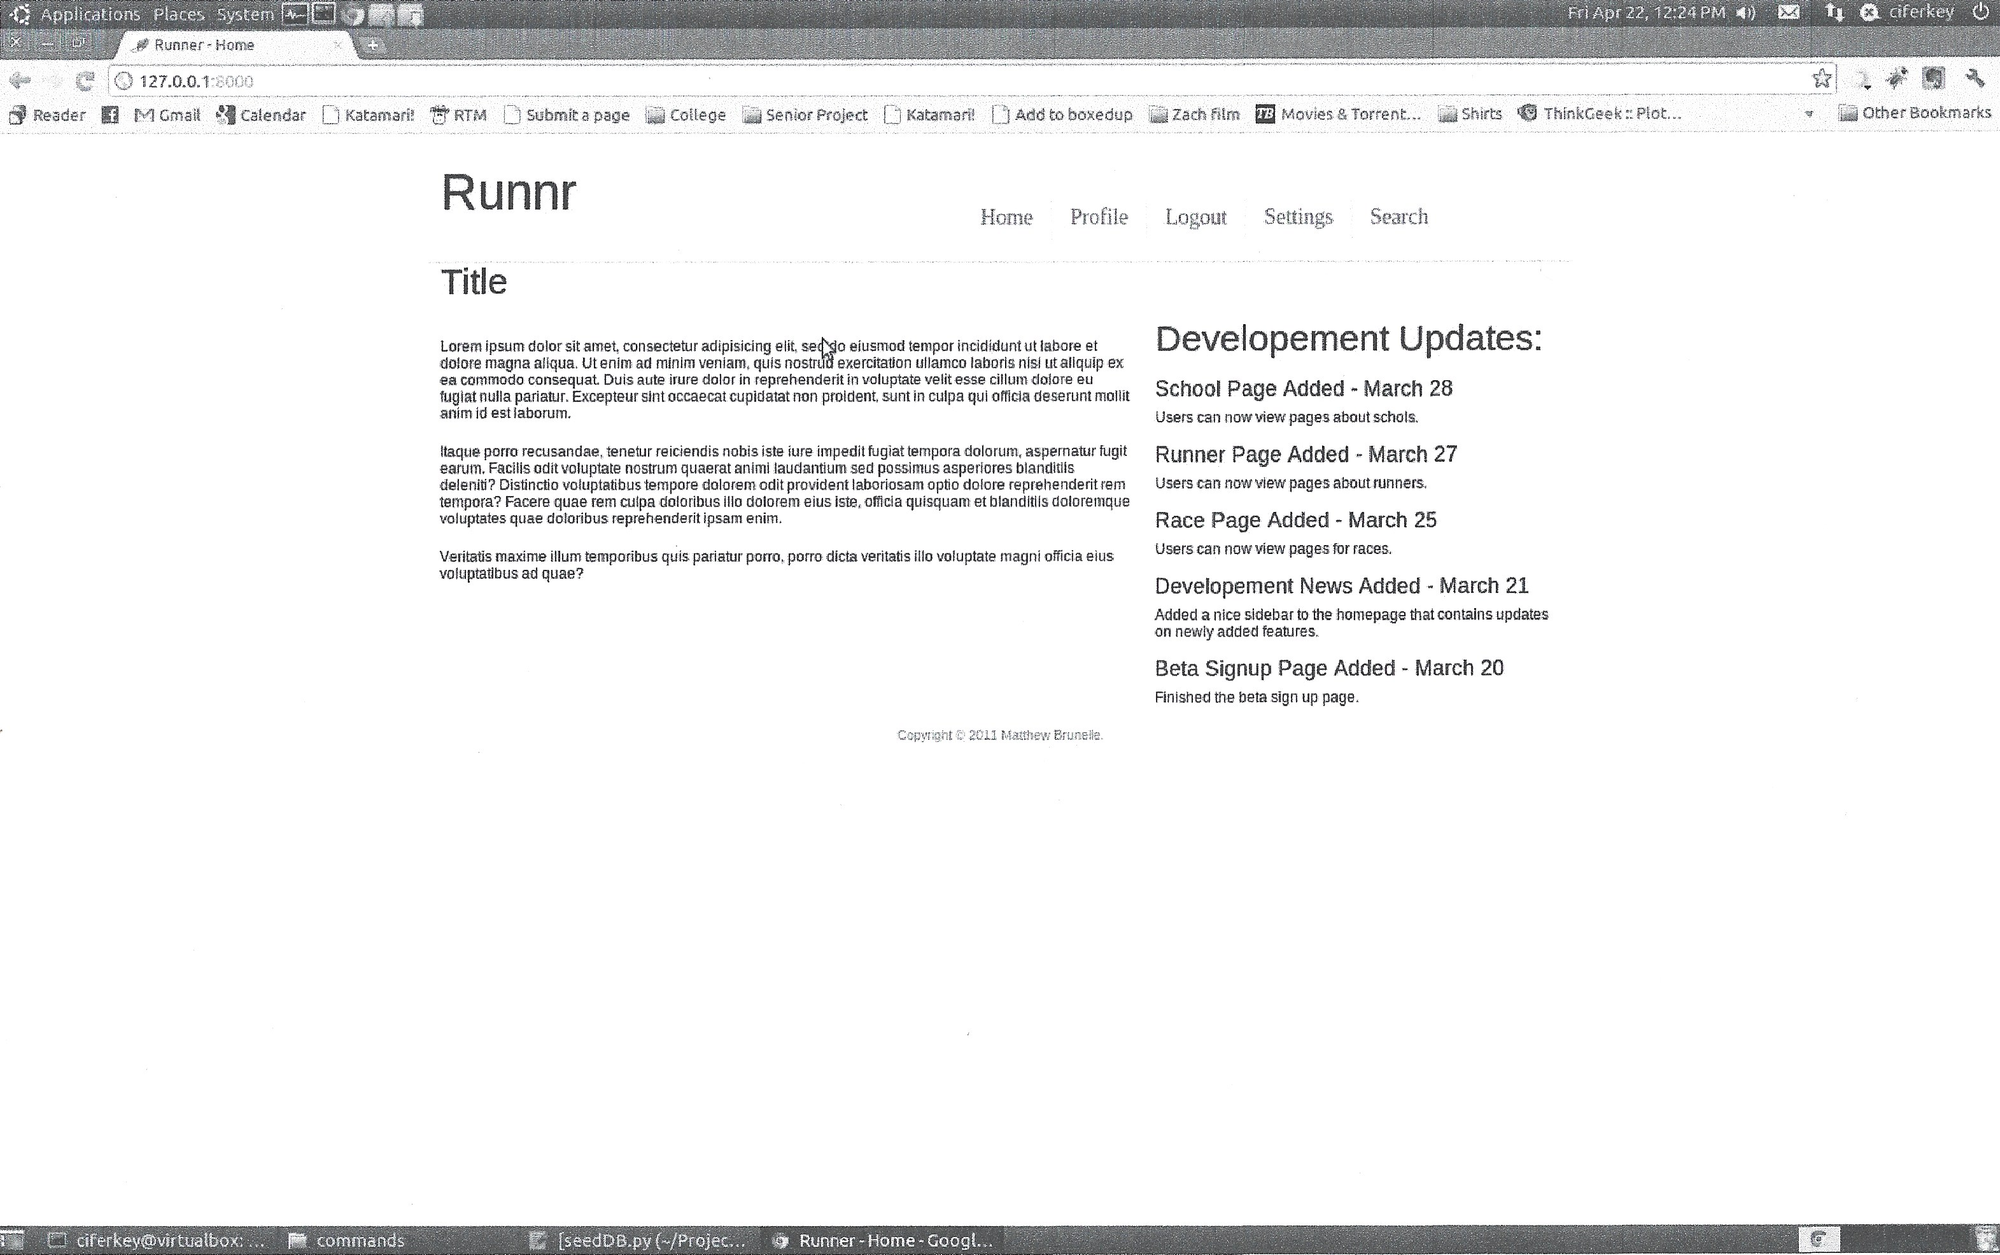
[^ Note that this was all done in an Ubuntu Virtual machine. I had a computer with Linux installed, but I regularly broke the install irreparably. If only NixOS https://blog.matthewbrunelle.com/tag/nixos/ existed then.]
You have to have a home page right? I didn't really know what to do so I put some Lorem ipum up.
An example of a race results page:
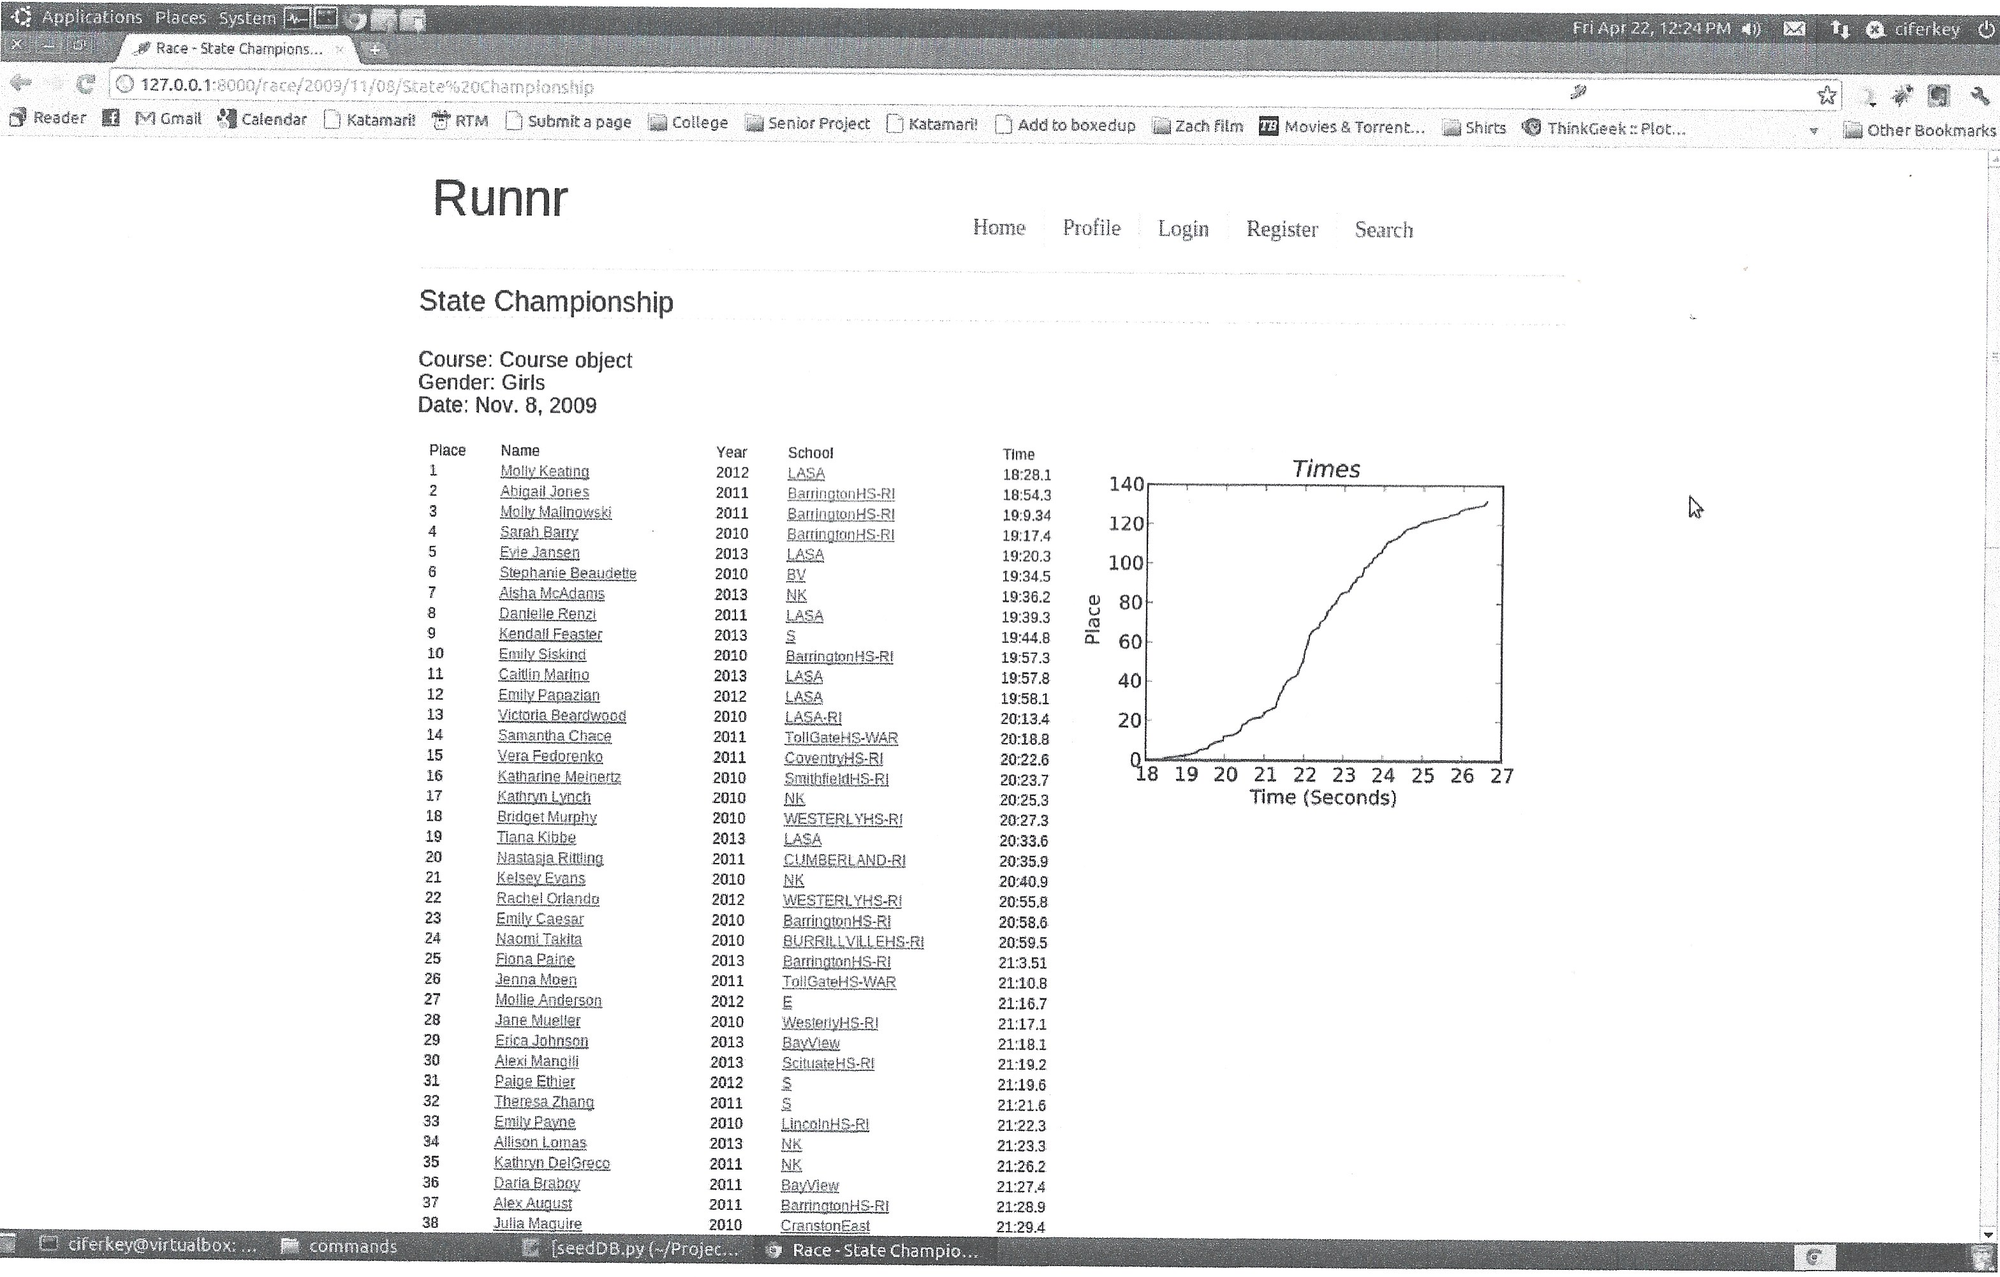
This was the 2009 Girls State Championships for RI. The right side shows the finish time in minutes [^ Yes I know, I incorrectly labeled the axis as seconds] versus the the place the runner finished. The school name would link to a page of all the athletes on the team. You could click an athlete's name and go to their profile page.
Here is my own profile page:
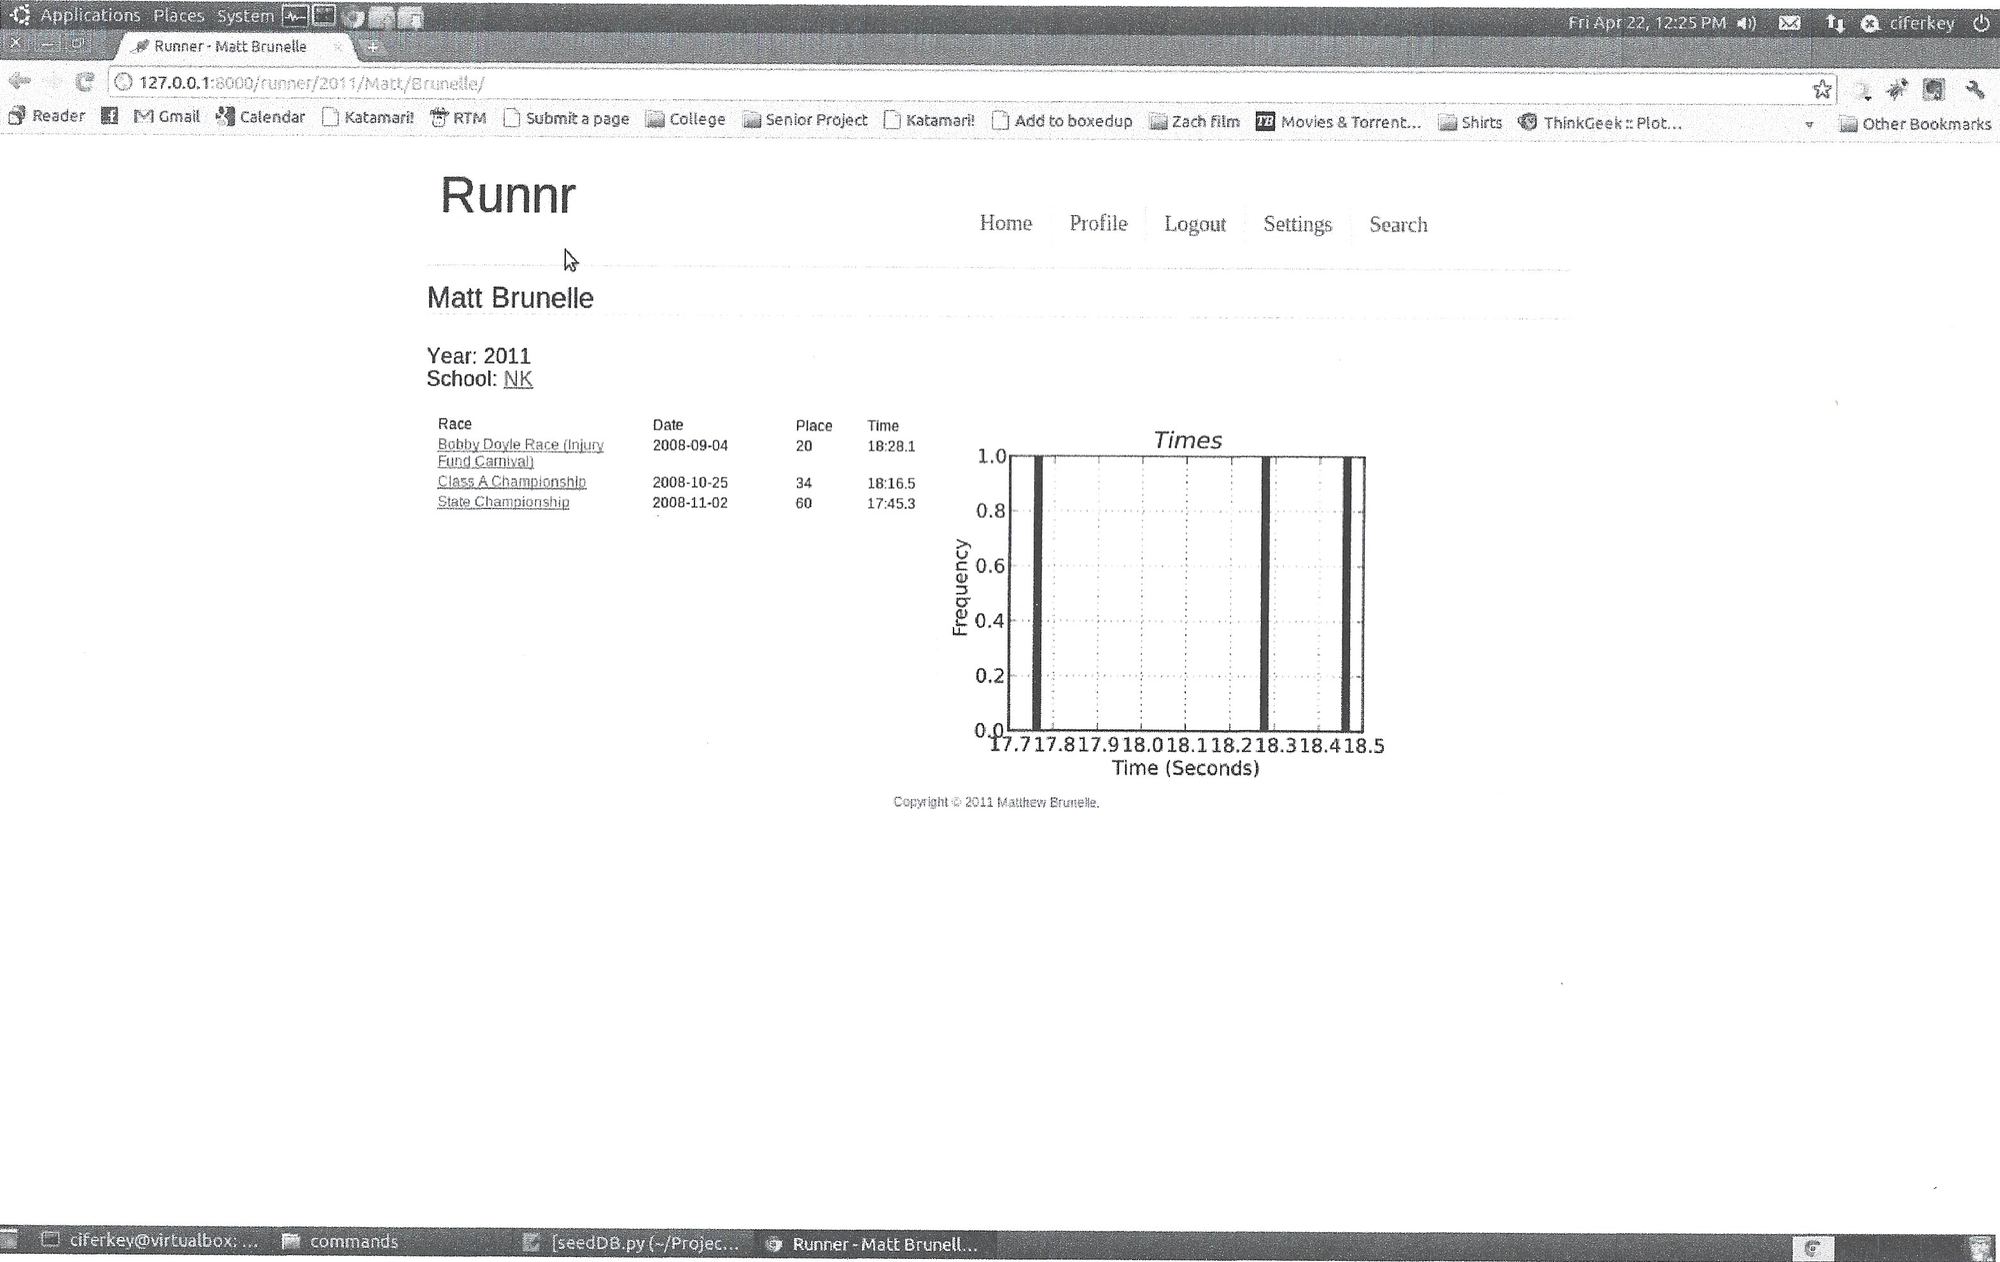
You could also hop back to a team or race page from a runners profile. Note how the visualization on the right makes no sense. At later version of the page showed the VDOTs over time instead.
Remember how the pipeline stored the data in MongoDB? Circa 2011 there wasn't official support so you had to use the janky django-mongodb-engine lib instead. Also, I was iterating pretty quickly so my data model would change frequently. In 2011 Django didn't have built in support for migrating models. You had to use South instead. [^ Eventually in release 1.7 Django would eat South.] The site was held together with bubblegum and paperclips, but work was finished in time for my project presentation.
The power of asking for free stuff when you are a student
At this point I had a front end put together, but no where to host the site. Self-hosting wouldn't come into my life until much later. I did have a powerful option though: asking for free stuff as a student.
The AWS free tier released in 2011, but I didn't know at the time. However, this period was also pre-consolidation so there were lots of startups. So I sent out many emails like this:
I'm a senior in high school who is working on a web application for fun. Do you offer any discounts on plans for students? Any help would be greatly appreciated.
With that I assembled the following team.
Web Hosting
I used ep.io for hosting the site. They seem to have shutdown in 2012, just after I did my project. [^ Their going away post is sadly not captured in the wayback machine.] Allegedly, they announced open sourcing the platform, but I cannot find a repository. Regardless, they were like Heroku, but for Python.
Aside from asking for a free account, I also pestered them over email about getting native libraries working on their platform so I could use matplotlib for generating my charts.
Database
Mongolab was a startup that provided MongoDB hosting. In 2016 they changed their name to mLab and in 2018 were acquired by MongoDB Inc. They answered my request very warmly:
Dear Matthew,
Thank you for your interest in MongoLab. We would be glad to give you a free beta account.
Thanks for telling us a bit about yourself and what you're working on. Psyched to know that high school students are using our service - would love a twitter mention (@mongolab) about your experience with our service if you feel up for it.
Version Control
In 2011 Github only allowed public repositories on free accounts. The student program didn't exist yet, so I filled out their support form. Their response was more terse:
From: Tekkub (Support staff)
Subject: [Contact] Student AccountsSure, use this coupon on your account:
The coupon was never setup with an expiration date, so I had premium until they retooled how accounts work.
Email
I wanted to allow registration on my site which meant I needed to send verification emails. So I messaged Postageapp for a free student account. They were the most jazzed about my request:
Hey Matthew,
Thanks for reaching out!
Like I mentioned, we don't have anything formally set up for students who wish to use the program. However, since I joined (back in December) I have been pushing for new initiatives to get some fresh blood in the system.
Enough of my rambling. We'd be happy to provide you with a free account for your cross country results tracking app. I assume that for low volume, a Carrier Pigeon account would be enough?
I chose Postageapp at the time because there was easy integration with django-postageapp.
I duct tapped all these free services together and got my site up and running.
Ship it
Finally my senior project was submitted and review. I went back to make some more updates, but I soon graduated and went off to college. School was exciting and I eventually forgot about the project until recently.
Looking back now though I realize how formative the whole experience was. I still hack away at personal projects, but I don't think I've attempted anything of the same scope and scale. I'm probably due for another cursed project, as they are the most fun.
Member discussion